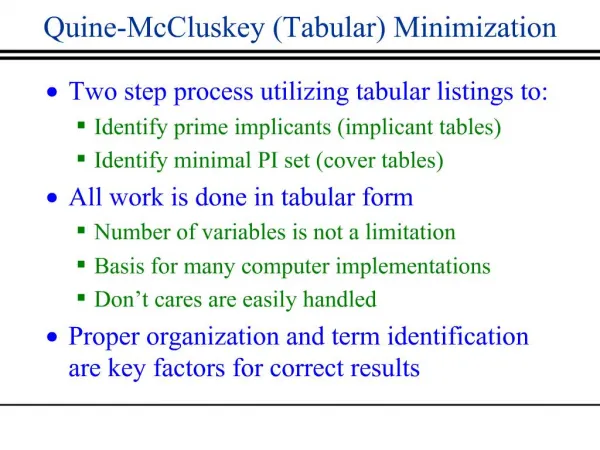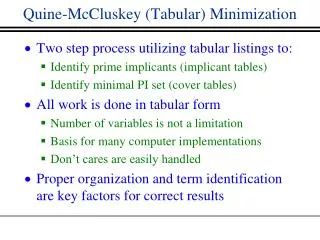
Tabular Reporting with R
This presentation by Charles R. Roosen, PhD, explores advanced techniques for reporting data in R using tabular formats. It covers the generation of tables in LaTeX with the widely-used `xtable` library and integrates them into documents via input or Sweave. Additionally, it discusses the capabilities of the Mango Reporting Library, which enables the creation of diverse report formats (PDF, RTF, HTML) while emphasizing collaborative editing in Microsoft Word. Attendees will learn about data representation essentials, including styling and formatting for clarity and professionalism.


Tabular Reporting with R
E N D
Presentation Transcript
Tabular Reporting with R Charles Roosen, PhD Technical Director Mango Solutions AG October 26, 2011
Agenda • Overview • Latex Documents • Generating Tables: xtable • Inserting Tables: \input or Sweave • Microsoft Word Documents • Generating Tables: Mango reporting library • Inserting Tables: Push2Doc
Overview • Why create tables? • Provide data listings or summaries • Where do tables go? • Latex documents • Word documents • What makes up a table? • Data values • Column labels, row labels, row groupings • Styling: Borders, shading, column widths • Captions
Generating Tables: xtable • Widely used library for Latex or HTML table generation • Created by David Dahl • Now maintained by Charles Roosen • On CRAN with development hosted on R-Forge http://r-forge.r-project.org/projects/xtable/
Creating an xtable object • Use the “xtable()” function to create an “xtable” object • Generic function with methods for many object types • Includes methods for: anova, aov, aovlist, coxph, data.frame, glm, lm, matrix, prcomp, summary.aov, summary.aovlist, summary.glm, summary.lm, summary.prcomp, table, ts, zoo • Other packages implement methods for “xtable()” • Object has properties regarding formatting of numeric values • Utility functions available to get/set these properties > objects("package:xtable") [1] "align" "align<-" "caption" "caption<-" [5] "digits" "digits<-" "display" "display<-" [9] "label" "label<-" "xtable"
Printing an xtable object • The “print()” method for “xtable” generates Latex or HTML • Lots of arguments controlling the markup used print(x, type="latex", file="", append=FALSE, floating=TRUE, floating.environment="table", table.placement = "ht", caption.placement="bottom", latex.environments=c("center"),tabular.environment = "tabular", size=NULL, hline.after=c(-1,0,nrow(x)), NA.string = "", include.rownames=TRUE, include.colnames=TRUE, only.contents=FALSE, add.to.row=NULL, sanitize.text.function=NULL, sanitize.rownames.function=sanitize.text.function, sanitize.colnames.function=sanitize.text.function, math.style.negative=FALSE, html.table.attributes="border=1", ...)
Inserting Tables in Latex • Inserting tables with “\input” • Step 1: Write the Latex to a file • Step 2: Reference this from the main Latex document with “\input” • Inserting tables with “Sweave” • Step 1: Write an “Rnw” file which is Latex with R code blocks • Step 2: Run “Sweave” to generate a Latex document with the R code evaluated and results inserted
Using Word for Reports • Microsoft Word has many features good for collaborative editing • Widely used • Spelling and grammar checkers • Review change tracking
Structuring the Work • Sweave is good for many uses, but … • Structure is one text file mixing Latex and R • There are benefits to separating the narrative text from the code • Easier to read and review • Non-programmers won’t understand the code • No “compile” cycle needed to see the updates • One approach • Write the narrative of the text in Word • Include references to tables and figures • Have separate script to generate the tables and figures • Use a tool to insert the figures into the document
Mango Reporting Library • Creates PDF, RTF, and HTML reports containing tables and figures • Rich set of table formatting capabilities
Table Objects tableObject tableColHeader tableHeaderItem tableHeaderItem tableBody tableHeaderItem tableHeaderItem tableRowHeader
R Functions > # Initialize Report (Environment) > createReport() > # Add a lattice plot > addGraphItem( xyplot( Y ~ X, data = myData )) > # Add a Summary Table > addTableItem( summaryTable(myData, c("X", "Y") ) ) > # Add a Data Table (basically a table of data) > addTableItem( dataTable( head(myData) ) ) > # Add some text > addTextItem( LETTERS ) > # Add a small histogram > addGraphItem( hist(rnorm(100)) ) > # Export this Environment to a document > publishReport("output.doc")
How it’s done • Architecture of the Reporting Library • R generates XML • Java code reads the XML and creates “iText” objects • “iText” used to create the PDF, RTF, HTML documents • Usage in the Reporting Workflow • Can create a complete document, such as a study report appendix • Can create a document with a single table for inclusion within a study report
Push2Doc • push2doc is a tool which allows users to insert pre-existing report items (graphs, images, tables and text) into a Word document. • Report items can be generated by the user’s tool or language of choice enabling push2doc to integrate seamlessly into the user’s workflow. • push2doc is a command line application which can be run on Windows via a batch file and on Linux via a shell script. • Additionally, it can be invoked from another modelling language e.g. R, SAS, Matlab. • An R wrapper is included in the distribution which allows push2doc to be called directly from R.
Push2Doc Usage • Push2Doc Steps • Create table and figure files for insertion • Create a Word (docx) template file • Call Push2Doc to create the Word document with insertions • Platforms • Cross-platform: Windows, Linux, Mac, etc. • Implemented in Java with no Microsoft Office dependencies • Execution • Simply call Java from a batch file (*.bat) or shell script (*.sh) • Self contained set of tools with no install other than Java
Table Specification • Table location and settings are specified by creating a “Comment” field in the Word document • Insert Menu -> Quick Parts -> Field… -> select ‘Comments’ from Field names list. • In the textfield marked ‘New comment’ add bookmark using the following syntax: modreport:BookmarkIdentifier[local|list of options] • Table data is in a CSV file • Can include notation for superscripts, subscripts, Greek symbols • Can specify hierarchical tables using a column of row “roles”
Summary • Latex tables and documents • xtable to create tables • Sweave or \input to insert tables • Word tables and documents • Mango reporting library for PDF, RTF, HTML • Mango Push2Doc for insertion of tables/figures into Word
Contact Us Mango Solutions AG Aeschenvorstadt 36 4051 Basel Switzerland +41 (0) 61 20692 92 croosen@mango-solutions.com