Download
1 / 14
160 likes | 455 Vues
The Theory of Comparative Advantage. Definition: a comparative advantage exists when one party can produce a good or service at a lower opportunity cost than another party. The Geometry of Comparative Advantage. Consider the example given in appendix 1A.

E N D
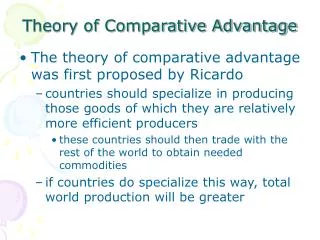
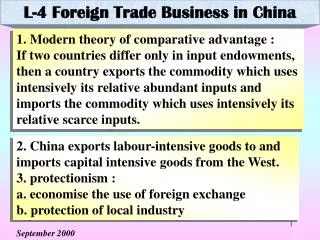
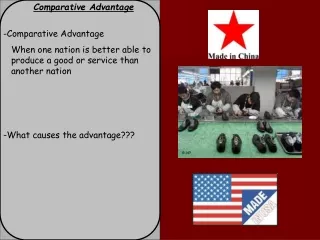
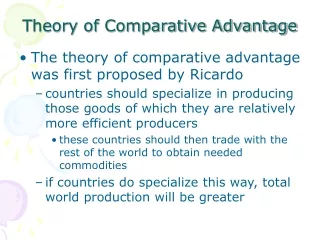
The Theory of Comparative Advantage • Definition: a comparative advantage exists when one party can produce a good or service at a lower opportunity cost than another party.
The Geometry of Comparative Advantage • Consider the example given in appendix 1A. • There are two countries, A and B, who can each produce only food and textiles. • Initially they do not trade with one another.
300 The Geometry of Comparative Advantage Textiles A production possibilities curve shows the various amounts of food or textiles that each country can make. The production possibilities of country A are such that if they concentrated 100% of their resources into the production of textiles, they could produce 180 million yards of textiles. If country A chose to concentrate 100% of their resources into the production of food, they could produce as much as 300 million pounds of food. 180 Food Country A can produce any combination of food and textiles between these two points.
300 The Geometry of Comparative Advantage Textiles As a practical matter, the citizens of country A must choose a point along their production possibilities curve; initially they choose 200 million pounds of food, and 60 million yards of textiles. 180 60 Food 200
240 900 The Geometry of Comparative Advantage Textiles The production possibilities of country B are such that if they concentrated 100% of their resources into the production of textiles, they could produce 240 million yards of textiles. If country B chose to concentrate 100% of their resources into the production of food, they could produce as much as 900 million pounds of food. 180 60 Food 200 300 1,200
240 80 600 900 The Geometry of Comparative Advantage Textiles As a practical matter, the citizens of country B must choose a point along their production possibilities curve; initially they choose 600 million pounds of food, and 80 million yards of textiles. 180 60 Food 200 300 1,200
The Geometry of Comparative Advantage Textiles Country A enjoys a comparative advantage in textiles because they have to give up food at a lower rate than B when making textiles. Put another way, country B enjoys a comparative advantage in food because they have to give up textiles at a lower rate than A when making more food. 240 180 Geometrically, a comparative advantage exists because the slopes of the production possibilities differ. 80 60 Food 200 300 600 900
The Geometry of Comparative Advantage Textiles If the countries specialize according to their comparative advantage, then country A should make textiles and trade for food, while country B should grow food and trade for textiles. 240 180 80 60 Food 200 300 600 900
420 1,200 The Geometry of Comparative Advantage Textiles Before trade, if both countries made only textiles, the combined production would be 420 million yards of textiles = 240 + 180. Before trade, if both countries made only food, the combined production would be 1,200 million pounds of food = 900 + 300. 240 180 80 60 Food 200 300 600 900
420 The Geometry of Comparative Advantage Textiles The combined production possibilities curve of country A and B without trade are shown in the green line. 240 180 80 60 Food 200 300 600 900 1,200
140 800 The Geometry of Comparative Advantage Textiles Before trade, the combined production is 800 million lbs of food and 140 million yards of textiles. 420 240 180 80 60 Food 200 300 600 900 1,200
180 900 The Geometry of Comparative Advantage Textiles County B can produce food at a lower opportunitycost, so let B produce the first 900 million pounds of food. Country A can produce textiles at a lower opportunity cost, so let them produce the first 180 million yards of textiles. 420 240 140 80 60 Food 200 300 600 800 1,200
The Geometry of Comparative Advantage Textiles The combined production possibilities curve with trade is composed of the original curves joined as shown. 420 240 180 140 80 60 Food 200 300 600 800 900 1,200
The Geometry of Comparative Advantage Textiles The gains from trade are shown by the increase in consumption available—an extra 100 million pounds of food and 40 million yards of textiles are now available in excess of the pre-trade consumption. 420 240 180 140 80 60 Food 200 300 600 800 900 1,200