Introduction to Epidemiology
Introduction to Epidemiology. Philippe Dubois From WHO Lyon: Marta Valenciano & Denis Coulombier. Epidemiology is …. For a student “the worst taught course in Medical school” For a clinician “The science of making the obvious” For a average person “ The study of skin diseases”

Introduction to Epidemiology
E N D
Presentation Transcript
Introduction to Epidemiology Philippe Dubois From WHO Lyon: Marta Valenciano & Denis Coulombier Phom Penh, Cambodia
Epidemiology is … • For a student • “the worst taught course in Medical school” • For a clinician • “The science of making the obvious” • For a average person • “ The study of skin diseases” • And for you ?
Epidemiology Epi = upon Demos = population Logos = study of
Definition « The study of the distributionand determinantsof healthrelatedstatesor eventsin specified human populationsand its applicationto the controlof health problems. » Last, 1988
Key words: • DistributionTime, place, person • DeterminantsCause, risk factors • Event / Health status • PopulationPublic health • ApplicationInformation for action
Clinician Person Medical history, physical examination Differential diagnosis Diagnostic test Treatment Epidemiologist Population Surveillance descriptive epidemiology Comparison Analytical epidemioogy Intervention (prevention/control) Clinic vs. Epidemiology
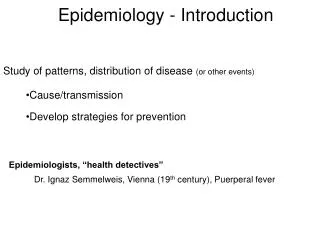
Epidemiological axioms • Diseases (or other health events) don’t occur at random • Diseases (or other health events) have causal and preventive factors which can be identified
Epidemiology helps to • Determine the magnitude and trends • Identify the aetiology or cause of disease • Determine the mode of transmission • Identify risk factors or susceptibility • Determine the role of the environment • Evaluate the impact of the control measures
Describean event in terms of : Time When? Place Where? Person Who? Analyse the association between the event (disease, death) and its determinants (risk factors) Make recommendations:preventive actions, control measures Main activities of the epidemiologist
Basic EpidemiologyMethods • Observation • Counts cases (events) • Determines rates, proportions (incidence, prevalence) • Compare rates • Develop and test hypothesis • Implement actions (control, prevention)
Epidemiology Classification • Experimental • Observational • Descriptive • Analytic • Cross-sectional • Cohort • Case-control
Descriptive epidemiology • First step in all data analysis • Allows to organise and summarise data in terms or time, place and person • Basis for building an inductive thought
Why describing ? • To get familiar with: • the data • the problem, its characteristics and magnitude • To determine groups at risk • To gather information for generating hypothesis on aetiology, transmission …. • To communicate the results
Descriptive Epidemiology Time • When have they been affected • Where have they been affected • Who has been affected Place Person
Time • Health events present variations over time • Graphical representation of data in a X, Y system: • Magnitude of the problem • Trends and potential evolution • Type of transmission • Other related events
Daily Notification of Cholera Cases, Paris, France, March-September 1832 1000 800 600 400 200 0 01/04/1832 01/05/1832 01/06/1832 01/07/1832 01/08/1832 01/09/1832 Day Source: Bulletin sanitaire journalier, Le Moniteur Universel.
Number of cholera cases by week, Guatemala, 1998 Hurricane Mitch Source: Ministerio de Salud, MSF
Time Outbreaks/Epidemics Epidemic curve Cyclic, endemic or chronic phenomena Trends Seasonal Secular
Epidemic curve • Graphic: Histogram • Time interval : • Hours, days, weeks… • Depends on incubation period • Helps in generating hypothesis about • Agent, • Source • Transmission route
9 Number of cases One case 7 5 3 0 12 13 14 15 16 17 18 19 20 21 22 23 24 25 26 27 Date of onset Gastroenteritis cases among residents of a long stay centre by date of onset of illness, Pennsylvania, 1986
Cases Watery diarrhea 15 Bloody diarrhea Cases Diarrhea with mucous 13 11 9 7 5 3 1 7/20 7/21 7/22 7/23 7/24 7/25 7/26 7/27 7/28 7/29 7/30 7/31 8/1 8/2 8/3 8/4 8/5 8/6 8/7 8/8 8/9 8/10 8/11 8/12 8/13 8/14 8/15 Day of onset Diarrhoea cases by date of onset, Tubna, Jordan July-August 2001
Distribution of cases (N = ) by day/month of onset/diagnostic, Region X, month/year. Number of cases 10 1 case 5 4 5 6 7 8 9 10 11 12 13 14 15 16 17 Time (hours, days, weeks, months) Elements in an epidemic curve
Continuous source N Person to person N 10 10 10 5 4 5 6 7 8 9 10 11 12 13 14 15 16 17 Point common source 5 5 N 4 4 5 5 6 6 7 7 8 8 9 9 10 10 11 11 12 12 13 13 14 14 15 15 16 16 17 17 Epicurves and Modes of Transmission
Person to Person Transmission Source: CDC
Person to Person Transmission Source: CDC
14 50 days 12 30 days 10 8 Number of cases 1 case 6 4 15 days 2 0 2 8 14 20 26 2 8 14 20 26 1 7 Days Exposure Hepatitis A by date of onset Ogemaw County, Michigan, April-Mai 1968
Trends over time • Seasonal trends • Linear graphic • Weeks, months • Secular trends • Periods including several years (>10 y) • Allows : • to predict evolution • To study the effect of control measures or other related events
Dengue cases by month Leon, Nicaragua, 1992-2000 92 93 94 95 97 98 99 2000 Source: SILAIS Leon, Nicaragua
Weekly reported diarrhoea cases in kura district, Irbid Governorate, Jordan 1994-2001
Place • Gives information on : • Geographic distribution • Cluster of cases • Dissemination route • Use of maps • Representation of cases and possible sources of exposure
Place • Geographical locations • Place of residence, work place, services in a hospital… • Geographical units • District, municipalities, neighbourhoods, streets, rooms… • Categories • Urban-rural, autochthonous-imported… • Place of exposure vs. place of notification
X PUMP B WORK HOUSE POLAND STREET MARSHALL STREET CARNABY STREET X BERWICK STREET PUMP A BROAD STREET BREWERY SILVER STREET REGENT STREET GREAT PULTENEY STREET GOLDEN X SQUARE PUMP X PUMP C X N PUMP W E S Cholera outbreak, London 1854
10 km Yasoku 0.2 Mombwasa 0.2 Yaimba 0.1 Yambala 0.7 Paipaie 0.2 Bakata 0.3 Bokoy 0.2 Bigi 1.0 Bunduki 0.4 4.6 Yambuku Bovange 0.7 Baisa 1.0 Eboy 1.4 Yapiki Moke 0.7 Yamolembia I 2.6 Yamisole 2.7 Yamolembia II 2.1 Yaeto Liku 1.3 Badjoki 1.8 Yandongi 0.9 Bongolo 1.6 Bodala 0.4 Bosambi 0.9 Lotaka 0.3 Lolo 0.7 Mdojambole 0.8 Mogbakele 0.2 Koloko 0.8 Yamisoli 0.1 Bongulu 0.1 Yaenengu 0.2 Ebola, attack rate by villageZaire, 1976
Person • Determine who is at risk • Different categories • Demographic: age,sex, ethnicity… • Socio-economic: education, occupation, access to services… • Individuals: blood group, vaccination status, smokers… • Presentation in table, graphs
Person: the age • Importance +++ • Reflects: • Susceptibility • Differences in exposure • Latency, incubation period
Attack rate by age group. S.Typhimurium, outbreak in Jura, France, May-June 1997 Source: Institut de Veille Sanitaire, Paris
Person: sex • Men and women different in • Susceptibility • Physiologic response • Exposures • Habits • Occupations
Person: others • Ethnic groups • Common social and biologic characteristics • Associated with socio-economic factors • Socio-economic • Difficult to establish • Occupation, education, income • Can reflect differences in exposure or access to services
Syphilis cases by sex. US 1981-90 Men Women
Syphilis cases by sex and racial group. US 1981-90 Black men Black women White men White women
The art of epidemiological thinking is to draw conclusions from imperfect data George W. Comstock