Download
1 / 1
10 likes | 122 Vues
In-Season Corn Nitrogen Measurement and Fertilization Via Image Analysis Upton Siddons, Larry Purcell and Morteza Mozaffari , University of Arkansas, Fayetteville. INTRODUCTION. RESULTS.

E N D
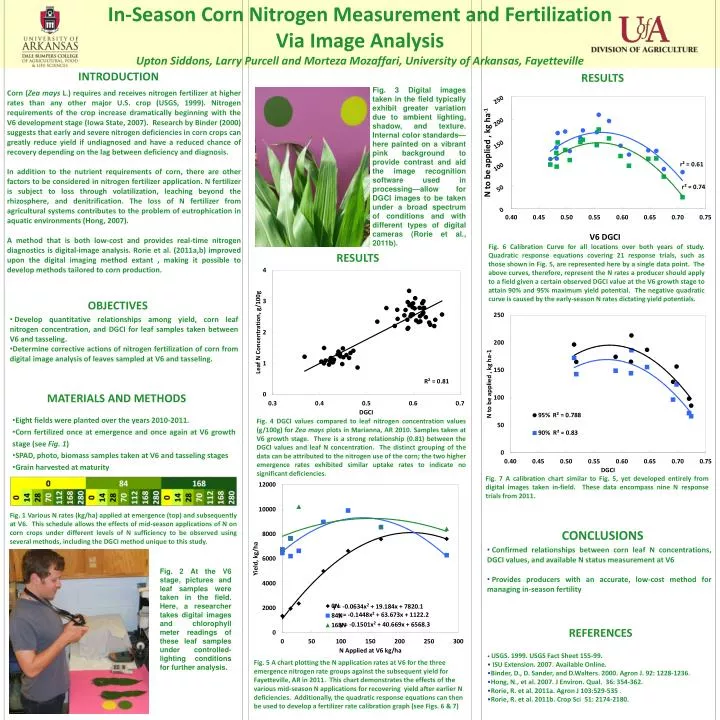
In-Season Corn Nitrogen Measurement and Fertilization Via Image Analysis Upton Siddons, Larry Purcell and MortezaMozaffari, University of Arkansas, Fayetteville INTRODUCTION RESULTS Fig. 3 Digital images taken in the field typically exhibit greater variation due to ambient lighting, shadow, and texture. Internal color standards—here painted on a vibrant pink background to provide contrast and aid the image recognition software used in processing—allow for DGCI images to be taken under a broad spectrum of conditions and with different types of digital cameras (Rorie et al., 2011b). Corn (Zeamays L.) requires and receives nitrogen fertilizer at higher rates than any other major U.S. crop (USGS, 1999). Nitrogen requirements of the crop increase dramatically beginning with the V6 development stage (Iowa State, 2007). Research by Binder (2000) suggests that early and severe nitrogen deficiencies in corn crops can greatly reduce yield if undiagnosed and have a reduced chance of recovery depending on the lag between deficiency and diagnosis. In addition to the nutrient requirements of corn, there are other factors to be considered in nitrogen fertilizer application. N fertilizer is subject to loss through volatilization, leaching beyond the rhizosphere, and denitrification. The loss of N fertilizer from agricultural systems contributes to the problem of eutrophication in aquatic environments (Hong, 2007). A method that is both low-cost and provides real-time nitrogen diagnostics is digital-image analysis. Rorie et al. (2011a,b) improved upon the digital imaging method extant , making it possible to develop methods tailored to corn production. Fig. 6 Calibration Curve for all locations over both years of study. Quadratic response equations covering 21 response trials, such as those shown in Fig. 5, are represented here by a single data point. The above curves, therefore, represent the N rates a producer should apply to a field given a certain observed DGCI value at the V6 growth stage to attain 90% and 95% maximum yield potential. The negative quadratic curve is caused by the early-season N rates dictating yield potentials. RESULTS OBJECTIVES • Develop quantitative relationships among yield, corn leaf nitrogen concentration, and DGCI for leaf samples taken between V6 and tasseling. • Determine corrective actions of nitrogen fertilization of corn from digital image analysis of leaves sampled at V6 and tasseling. MATERIALS AND METHODS • Eight fields were planted over the years 2010-2011. • Corn fertilized once at emergence and once again at V6 growth stage (see Fig. 1) • SPAD, photo, biomass samples taken at V6 and tasseling stages • Grain harvested at maturity Fig. 4 DGCI values compared to leaf nitrogen concentration values (g/100g) for Zeamays plots in Marianna, AR 2010. Samples taken at V6 growth stage. There is a strong relationship (0.81) between the DGCI values and leaf N concentration. The distinct grouping of the data can be attributed to the nitrogen use of the corn; the two higher emergence rates exhibited similar uptake rates to indicate no significant deficiencies. Fig. 7 A calibration chart similar to Fig. 5, yet developed entirely from digital images taken in-field. These data encompass nine N response trials from 2011. Fig. 1 Various N rates (kg/ha) applied at emergence (top) and subsequently at V6. This schedule allows the effects of mid-season applications of N on corn crops under different levels of N sufficiency to be observed using several methods, including the DGCI method unique to this study. CONCLUSIONS • Confirmed relationships between corn leaf N concentrations, DGCI values, and available N status measurement at V6 • Provides producers with an accurate, low-cost method for managing in-season fertility Fig. 2 At the V6 stage, pictures and leaf samples were taken in the field. Here, a researcher takes digital images and chlorophyll meter readings of these leaf samples under controlled-lighting conditions for further analysis. REFERENCES • USGS. 1999. USGS Fact Sheet 155-99. • ISU Extension. 2007. Available Online. • Binder, D., D. Sander, and D.Walters. 2000. Agron J. 92: 1228-1236. • Hong, N., et al. 2007. J Environ. Qual. 36: 354-362. • Rorie, R. et al. 2011a. Agron J 103:529-535 . • Rorie, R. et al. 2011b. Crop Sci 51: 2174-2180. Fig. 5 A chart plotting the N application rates at V6 for the three emergence nitrogen rate groups against the subsequent yield for Fayetteville, AR in 2011. This chart demonstrates the effects of the various mid-season N applications for recovering yield after earlier N deficiencies. Additionally, the quadratic response equations can then be used to develop a fertilizer rate calibration graph (see Figs. 6 & 7)