Download
1 / 21
210 likes | 327 Vues
County-level Characteristics Associated with Gonorrhea Rates – United States, 2002. M Greenberg, M Sternberg, E Swint, R Kerani, E Koumans mgreenberg1@cdc.gov. Background. Gonorrhea is the 2 nd most frequently reported communicable disease in the US 351,852 cases reported to CDC in 2002

E N D
County-level Characteristics Associated with Gonorrhea Rates – United States, 2002 M Greenberg, M Sternberg, E Swint, R Kerani, E Koumans mgreenberg1@cdc.gov
Background • Gonorrhea is the 2nd most frequently reported communicable disease in the US • 351,852 cases reported to CDC in 2002 • Rates have declined dramatically in the past two decades • Significant disparities remain geographically and by race
Gonorrhea — rates by race and ethnicity: United States, 1981–2002 and the Healthy People 2010 objective
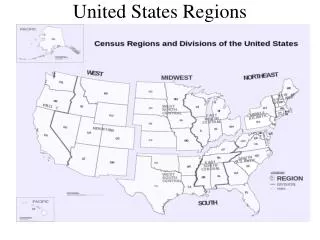
Gonorrhea — rates by region: United States, 1981–2002 and the Healthy People 2010 objective
Objectives • Identify county-level characteristics independently associated with the gonorrhea rate • Evaluate effects of race and geographic clustering on county-level predictors
Sources of data • National Electronic Telecommunications System for Surveillance (NETSS) • US Census 2000 Summary File 3 3,141 United States Counties • SAS USA Counties Map file (SAS Institute Inc., Cary, NC)
Methods - univariate analysis • Census variables chosen • socio-demographic relevance • comparison with other studies • Grouped into categories felt to measure different effects • Density, race/ethnicity, family structure, poverty/income, fertility/health, crime, education, housing • Correlated variables independently with the gonorrhea rate
Methods: multivariate analysis • Most strongly correlated variable from each category included in the regression model • Ordinary least squares (OLS) residual showed spatial autocorrelation • Demonstrated need for a multivariate spatial model • Spatial model explains all variables controlling for spatial autocorrelation
Measuring spatial effects • One county and its “neighbors” • “Neighbors” related by: • Distance • Contiguity
Spatial autocorrelation • Pairs of adjacent counties where the gonorrhea rate is significantly correlated and may in some way influence one another • High-high • Low-low • Not significant
Univariate analysis:Correlation between county-level characteristics and gonorrhea rate* *log-transformed ‡p<0.0001
High-high Spatial autocorrelation Low-low Low-high High-low Not significant
Multivariate models *log-transformed ‡ p<0.05; all others p<0.001
Change in gonorrhea rate for one standard deviation increase in each variable % Pop. Black* % Female HH % Rent occupied* Serious crimes/100,000 % ≥25 HS grad % Pop 18-44 years Persons/sq mile* Change in Gonorrhea Rate (persons/100,000 population) *log scale
Limitations • Ecologic study • Effects of differential reporting by states not included in the model • Spatial autocorrelation may be a surrogate for an unmeasured county-level variable or an artifact of county partitioning • County may not be most appropriate area level for analysis • Model does not include measures of health resource utilization
Summary • The gonorrhea rate varied significantly across US counties • There was significant geographic clustering • Clustering was not explained by measured population characteristics alone • Relative contribution of certain county-level characteristics changed when accounting for geographic clustering
Recommendations • Consider geographic clustering as an important effect in analyses of STD surveillance data • County-level characteristics and geographic context may help direct screening and prevention efforts.
Acknowledgements • CDC • Emily Koumans • Maya Sternberg • Emmitt Swint • Hillard Weinstock • James Heffelfinger • Stuart Berman • University of Washington • Roxanne Kerani