Monthly Energy Value Comparisons: EIA vs. Operator Reports Across Regions
80 likes | 194 Vues
This report analyzes monthly energy values reported by the EIA and compares them with data from various operators, including USBR, COE, and PAC for the years 2001, 2005, and 2010. Monthly energy differences are calculated to identify trends, with a focus on plants with pumped storage where discrepancies were noted. Findings reveal random variations year-to-year and month-to-month, with significant differences typically observed in specific years for particular regions. This highlights the need to examine how data is reported to the EIA and its implications on energy assessments.

Monthly Energy Value Comparisons: EIA vs. Operator Reports Across Regions
E N D
Presentation Transcript
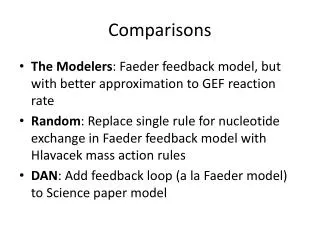
Compared EIA-reported monthly energy values with those obtained from operators • USBR (East and CA), COE (NW), PAC (NW and CA), CA non-ISO (SMUD, LADWP, CCSF, TIDC) • Looked at 2001, 2005, and 2010 data where available • Compared monthly energies for both data sources • Calculated differences (Actual-EIA) to see trends • Calculated the average monthly energy differences for each month • Calculated the total average monthly energy difference for each plant
NW COE/EIA (2001, 2005, 2010) Fairly consistent for all data years Random differences for all data years *March 2001 was off for all plants Due to 2005 data Consistently different for all data years – this was typical for plants with pumped storage
CA Non-ISO/EIA (2001) TIDC Again, large differences for pumped storage
PAC/EIA (2001, 2005) Average differences mainly due to 2005 data
EAST USBR/EIA (2001, 2005, 2010) Due to 2010 data Due to 2001 data Consistently different Pumped storage
Observations/Conclusions • EIA/Operator monthly energy differences fairly random • Sometimes it seems a particular year is off (PAC 2005), sometimes just a month (NW COE March 2001) • Plants with pumped storage generation capacities have consistent EIA/Operator differences • How is data reported to EIA? • Importance?