Download
1 / 7
70 likes | 189 Vues
This document outlines the application and benefits of a Quality Improvement Priority Matrix within a university department. Developed and utilized at The George Washington University, the matrix serves as a data-driven decision-making tool that enhances focus on customer priorities and aids in performance benchmarking across departments. It promotes clarity and engagement among managers and subordinates by highlighting crucial areas for improvement. By comparing performance over time, organizations can effectively measure the impact on satisfaction and adapt to emerging customer demands.

E N D
Using a Quality Improvement Priority Matrix in a University Department Stuart A. Umpleby The George Washington University Washington, DC
History of the Priority Matrix • Described by GTE Directories in their 1995 Baldrige Award presentation • Used by Armstrong Building Products Operations in their 1996 Baldrige Award Presentation • Used by faculty and student projects at GWU for several years
Advantages of a Priority Matrix • Can be used to improve any organization or any product or service • Is a way to do “data-driven decision-making” as opposed to “fire-fighting” • Easy for everyone to understand • Technically simple – Excel is sufficient • Customer priorities become clear • Shows managers where to focus attention
How the matrix aids managers • Provides an agenda for subordinates to work on • Priorities in different departments can be compared • Performance in different departments can be compared which aids benchmarking
Comparing matrices over time • Effects of improvements on customer or employee satisfaction can be measured • New demands by customers become visible
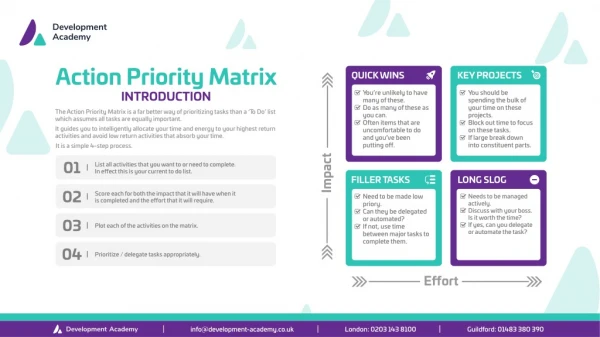
How to present the results • Focus on the items in the high importance, low performance quadrant • List items in decreasing order of importance and increasing order of performance • Use bar graphs to show changes in importance and performance • Show with arrows how the ratings have changed • Plot the differences in scores on a “change matrix”
Observations • Very few items are rated low on importance • When performance improves, importance usually declines • When importance increases, performance usually decreases • The matrix receives high approval ratings