Download
1 / 1
10 likes | 119 Vues
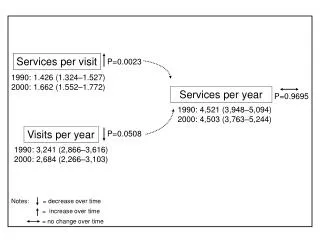
This analysis examines the changes in healthcare service utilization from 1990 to 2000. The study focuses on services per visit and services per year, along with the total visits per year. Results indicate a slight decrease in services per visit from 1.426 (1990) to 1.662 (2000) and a marginal drop in total visits from 3,241 to 2,684. The findings suggest a shift in healthcare engagement patterns over the decade, underscoring the evolving landscape of patient care and service delivery.

E N D
Services per visit P=0.0023 1990: 1.426 (1.324–1.527) 2000: 1.662 (1.552–1.772) Services per year P=0.9695 1990: 4,521 (3,948–5,094) 2000: 4,503 (3,763–5,244) Visits per year P=0.0508 1990: 3,241 (2,866–3,616) 2000: 2,684 (2,266–3,103) Notes: = decrease over time = increase over time = no change over time