Download
1 / 92
1.04k likes | 1.63k Vues
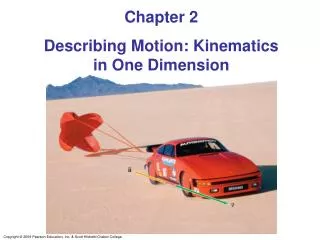
Describing Motion KINEMATICS in One Dimension. “To understand motion is to understand nature.” Leonardo da Vinci. Chapter 2. MECHANICS Study of motion, force and energy. Kinematics How objects move. Dynamics Why objects move. Kinematics Objectives.

E N D
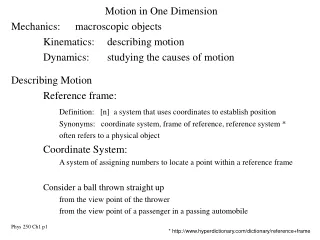
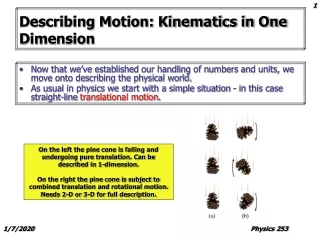
Describing Motion KINEMATICS in One Dimension “To understand motion is to understand nature.” Leonardo da Vinci Chapter 2
MECHANICS Study of motion, force and energy Kinematics How objects move Dynamics Why objects move
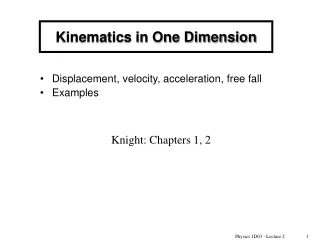
Kinematics Objectives • Represent motion through the use of words, motion diagrams, graphs, and mathematical models. • Use the terms position, distance, displacement, and time interval in a scientific manner to describe motion.
Reference Frames Any measurement of position, distance or speed must be made with respect to a frame of reference 80 km/h
Distance and Displacement Distance, d – total ground covered Displacement, Dx – change in position of an object (position is measured from the origin of a chosen coordinate system)
Distance and Displacement Example - A car travels 400 km from Livingston to Philadelphia and then back 200 km to Trenton. What is the displacement of the car? What distance did the car travel? X = 0 0 100 200 300 400 km Livingston Trenton Philadelphia displacement distance
Displacement Has magnitude (size) and direction. It is a VECTOR Vectors are represented by arrows x(m) 1 2 3 -1
Displacement Has magnitude and direction. It is a VECTOR x(m) 1 2 3 -1
Average Speed and Average Velocity • Average speed describes how fast a particle is moving. It is calculated by: • Average velocity describes how fast the displacement is changing with respect to time: always positive Scalar (has magnitude only) sign gives direction in 1 Dimension Vector (has magnitude and direction) Average speed and average velocity often have the same magnitude, but not always
Example - A car travels 400 km from Philadelphia to Livingston in 2 hours and then back 200 km to Trenton in 1 hr. What is the car’s speed and velocity? Dx X = 0 100 200 300 400 km Livingston Trenton Philadelphia Average speed Average velocity
Example • The position-time graph shows the progress of two runners, A and B. • When does runner B pass runner A? • Where does runner B pass runner A? • What is the starting position for runner A? runner B? • After 10 hrs, what is the average velocity of runner A? After 10 hrs, what is the average velocity of runner B? • If the finish line is at 40 km, who won the race?
B Dx A Dt Graphical Representation of Motion Position-Time Graph x slope t Steepness = speed slope Sign = direction Velocity = speed + direction
B A Dx Dt Average Velocity from a Graph x t Mathematical Model x = position x0 = initial position v = average velocity t = time
Graphs of Motion Mathematical Model Dx=20m Slope x0 = 20 m v = 2 m/s Dx=20m SLOPE AREA Mathematical Model (UNIFORM VELOCITY) Area=20m = Dx Area (init and final positions unknown. ONLY KNOW DISPLACEMENT)
What is happening in this graph? Mathematical Graphical 5s 4s 3s 2s t=0 s START End t=6 s 1s X = -10 -5 0 5 10 15 20 m Diagrammatic v =
Plot the corresponding v-t graph x0 = 20 m v = -5 m/s Slope SLOPE
Draw the corresponding v-t graph v-t SLOPE
Draw the corresponding x-t graph v-t AREA Dx= +12m 3m Area= Dx -6m Dx= -16m
Average Velocity and Instantaneous Velocity Average velocity only depends on the initial and final positions. These 2 cars have the same average velocities but different velocities at each instant. When the velocity is not uniform, the instantaneous velocity is not the same as the average velocity. AVERAGE VELOCITY: X = -40 -20 0 20 40 60 80 km X = -40 -20 0 20 40 60 80 km Start t=0 End t=2 hr
x Dx Dt t Average Velocity from a Graph A B Remember that the average velocity between the time at A and the time at B is the slope of the connecting line, the secant line.
How can we find the instantaneous velocity at a point? x A B t What happens if A and B become closer to each other?
Average Velocity from a Graph x B A t What happens if A and B become closer to each other?
Average Velocity from a Graph x B A t What happens if A and B become closer to each other?
Instantaneous Velocity from a Graph x A and B are effectively the same point. The time difference is effectively zero. B A t The line “connecting” A and B is a tangent line to the curve. The velocity at that instant of time, v, is represented by the slope of this tangent line.
Instantaneous Velocity from a Graph x B t The instantaneous velocity at B is the slope of the tangent line at B
Example:What is the instantaneous velocityat t=1s? 3.5s? 6 s?What is the average velocity for the first 1 s? the first 3.5 s? the first 6 s? What is the average speed for the first 1 s? the first 3.5 s? the first 6 s? Instantaneous velocity Average velocity Average speed
Acceleration • Average acceleration describes how the velocity changes with respect to time. It is calculated by: Vector SI units: m/s2 • Instantaneous acceleration describes how the velocity changes over a very short time interval: Acceleration tells us how fast the velocity changes whereas velocity tells us how fast the position changes.
Example - A car accelerates along a straight road from rest to 87 km/hrin 6.0 s. What is the average acceleration? Average acceleration START 1s 2s 3s 4s 5s 0 x 0 4 8 12 16 20m/s v a 4m/s2
v a x Position-Time Graph t=5 t=4 t=3 t=2 t=1 t=0 START 1s 2s 3s 4s 5s x
Speeding up in + direction aandv SAME direction START 1s 2s 3s 4s 5s 0 x v a Slowing down in + direction aandv OPP direction START 1s 2s 3s 4s 5s 0 x v a
Speeding up in - direction aandv SAME direction START 0 5s 4s 3s 2s 1s x v a Slowing up in - direction aandv OPP direction START 5s 4s 3s 2s 1s 0 x v a
Displacement and velocity are in the direction of motion • When acceleration is in the SAME direction as velocity, the object is speedingup • When acceleration is in the OPPOSITE direction to velocity, the object is slowingdown
v a x Speeding up in + direction t=5 Position-Time Graph t=4 t=3 t=2 t=1 t=0 START 1s 2s 3s 4s 5s 0 x
Slowing down in + direction x v a t=5 Position-Time Graph t=4 t=3 t=2 t=1 t=0 START 0 1s 2s 3s 4s 5s x
Speeding up in - direction t=0 v a x t=1 t=2 t=3 t=4 t=5 START 0 5s 4s 3s 2s 1s x
Slowing down in - direction v a x t=0 t=1 t=2 t=3 t=4 t=5 START 5s 4s 3s 2s 1s 0 x
Draw the corresponding v-t and a-t graphs x-t graph v-t graph a-t graph
What is this object doing? Slowing down in - direction v a x t=0 t=1 t=2 t=3 t=4 t=5 START 5s 4s 3s 2s 1s 0 x
Speeding up in - direction What is this object doing? t=0 v a x t=1 t=2 t=3 t=4 t=5 START 0 5s 4s 3s 2s 1s x
Graphical Representation of Motion(Uniform Velocity) AVERAGE VELOCITY SLOPE = For motion with constant velocity NO acceleration Connect with straight line SLOPE AVERAGE acceleration AREA SLOPE = AREA under curve Dx=12 Dx=15 Dx=6 Dx=9 Dx=3 RUNNING TOTAL
Constant Acceleration Motion AVERAGE VELOCITY SLOPE = acceleration Connect with curved line No physical meaning AREA slope AVERAGE acceleration SLOPE= AREA AREA slope AREA SLOPE = Dv=-9 AREA RUNNING TOTAL
SLOPE = Velocity NOT constant slope AREA SLOPE = Dx AREA slope constant acceleration AREA AREA Dv
PHYSICS DEPARTMENT STORE SLOPE AREA SLOPE AREA
Estimate the net displacement from 0 s to 5.0 s Area under v-t curve Dx= 4.5 + 6 = 10.5 m
Construct the corresponding x-t and a-t curves Straight (constant v) Curved (acceleration) AREA slope
Estimate the displacement from 0 s to 4.0 s Area under v-t curve Dx= 2 -2 = 0 m
Construct the corresponding x-t and a-t curves All Curved (acceleration) AREA slope
What is the acceleration at 1 s, at 3 s and at 6 sec? • What is the total displacement for the entire trip? • What is the distance traveled for the trip? a1=2m/s2, a3=0m/s2, a6=-4m/s2 Dx0-10= 6m d0-10= 30m
curved Construct the corresponding x-t and a-t curves straight straight curved curved B AREA A C D F E slope
QUIZ IS UP TO HERE http://theuniverseandmore2.blogspot.com/