Download

1 / 50
510 likes | 564 Vues
Discover the systematic approach of the scientific method for effective problem-solving. Explore steps from identifying a problem to publishing results, engaging in observation, hypothesis, experimentation, and conclusion to advance your research.

E N D
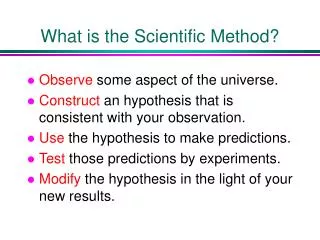
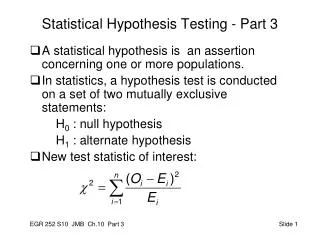
THE SCIENTIFIC METHOD The scientific method is a systematic approach to problem solving that involves observation and experimentation.
THE SCIENTIFIC METHOD • Identify a problem (observation) • State a hypothesis • Test the hypothesis (experiment) • Form a conclusion • Publish results Let’s look at these steps in more detail…
1. Identify a Problem When a scientist observes a phenomenon, it may occur to them to ask questions… Why? How? What? When these questions are asked, a scientist has identified a problem that can be solved using the scientific method.
1. Identify a Problem For example: Observation: the leaves on a tree have turned from green to orange. Problem: why do leaves change color?
1. Identify a Problem Once a problem is identified, a scientist must then do research and gather information to find out what is already known about the problem.
1. Identify a Problem This information will help the scientist choose possible solutions to the problem. Which takes us to the next step….
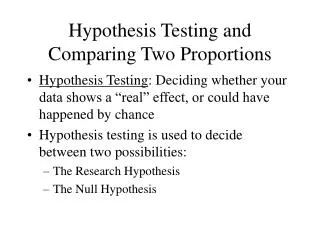
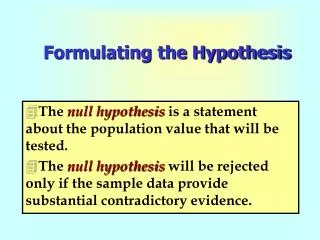
2. State a hypothesis A hypothesis is a possible solution of a scientific problem. A hypothesis should not be a “wild guess”. A hypothesis should be based on careful research into what is already known about the problem.
3. Test the hypothesis How does a scientist test a hypothesis? A scientist can test a hypothesis by designing an experiment. An experiment is a procedure to test a hypothesis under controlled conditions. In order to have a controlled experiment, it’s important to focus on only one variable.
3. Test the hypothesis For example: If a scientist wanted to study how different kinds of fertilizer affect plant growth, they would make sure that the plants in the study were all the same kind, that they received the same amount of water, soil and light, and that the different types of fertilizer would be given in the same amount.
3. Test the hypothesis Independent variable: the factor that is tested in the experiment. Dependent variable: a factor that results from, or depends on changes to, the independent variable. All other factors must remain constant… A constant is a factor that does not change in the experiment.
3. Test the hypothesis Control group: the group used for comparison, it does not contain the independent variable. Experimental group: the group that is tested. It contains the independent variable and is compared to the control group.
3. Test the hypothesis As the experiment progresses, it is important for a scientist to continue to make many observations to collect data. Data: information gained from observations made during an experiment. Data can be quantitative (numerical data), or qualitative (information collected by the senses).
3. Test the hypothesis What kinds of quantitative data could be collected about the parrots in the picture?
3. Test the hypothesis What kinds of qualitative data could be collected about the snake(s) in this picture?
3. Test the hypothesis It is also important to keep a record of everything that is done during an experiment so that the experiment can be repeated by other scientists. WHY?????
4. Form a conclusion When the experiment is concluded, scientists must organize the data they have collected.
4. Form a conclusion When the experiment is concluded, scientists must organize the data they have collected. One way of doing this is to make charts or graphs of the data.
4. Form a conclusion Once the data is organized, a scientist can then analyze the data to try and understand what it means.
4. Form a conclusion They can then come to a conclusion and decide if their hypothesis was correct or incorrect.
4. Form a conclusion In light of their conclusions, scientists may revise their hypothesis. They may then design another experiment to test their new hypothesis.
5. Publish results Scientists must publish results so that their work can be shared with other scientists. This can be in the form of a lab report, a scientific paper, or even a book. When other scientists read about the experiment, they can repeat the steps to verify the first scientist’s conclusions.
5. Publish results This verification process is called peer review.
5. Publish results This verification process is called peer review. Peer review: a formal process where the results and methods of a scientist’s research are examined by other scientists in the same field.
The Scientific Method 1. Identify a problem (make observations, ask questions, gather information, do research) 2. State a hypothesis (based on research) 3. Test the hypothesis (design and conduct an experiment, make observations, document procedure) 4. Form a conclusion (organize data, analyze data, figure out the meaning of the data) 5. Publish results (write a lab report, share information with other scientists, repeat experiment)
The scientific method is really just organized common sense. If you want to solve a problem, you make observations about the nature of the problem, think of possible solutions, and then test those possible solutions until the problem is solved.
Graphs Independent variable • should be placed on the horizontal or x-axis.
Graphs Independent variable Dependent variable • should be placed on the horizontal or x-axis. • is the result of what happens because of the independent variable
Graphs Independent variable Dependent variable • should be placed on the horizontal or x-axis. • is the result of what happens because of the independent variable; placed on the y or vertical axis.
3 Types of Graphs Dependent variable Independent variable • Line graph – used when showing variances with in a single group
3 Types of Graphs Dependent variable Independent variable • Line graph – used when showing variances with in a single group; used to visualize the value of something over time.
3 Types of Graphs • Bar graph – used when showing variances among groups.
3 Types of Graphs Dependent variable Independent variable • Bar graph – used when showing variances among groups.
3 Types of Graphs • Pie chart – used to illustrate numerical proportions.
3 Types of Graphs Independent variable Dependent variable • Pie chart – used to illustrate numerical proportions. Represents quantities, usually percentages.
Warm-up 8/12/2019 Biology/Human A & P Differentiate dependent and independent variables.
Warm-up 8/10/2018 Biology/Human A & P Using your phone, research the reason why your heart rate increases when you increase your activity! This should prepare you for your “Heart Rate” lab.
Heart Rates Lab When you go for a fast run, you notice that you start to pant and sweat. Have you ever thought about what happens to your heart? In this activity you will investigate what happens to your heart rate as you increase your activity level. Problem/Question: What happens to a person’s heart rate as that person increases his or her activity level?
Information/Research: Take some time to gather information on heart rates and how/why they fluctuate as a person’s activity level changes.
Hypothesis: IF a person increases his or her activity level, THEN _____________________________________________________________________________________________________________________ BECAUSE______________________________________________________________________________________________________________________________________________________________________________
Procedures: • Find your heart beat by placing two fingers on your wrist. Ask for assistance if you experience any difficulty with this task. • Count each thump as one beat. • Sit in your chair. Have your partner time you for ten seconds as you count the number of beats. • Multiply the number of beats by six. This is how much your heart beats in a minute while you are resting (your resting heart rate). • Record the number of beats in the data table. • Stand up and have your partner time you for one minute as you walk around the class. At the end of a minute count the number of beats for ten seconds. Multiply the number of beats by six to determine the number of heart beats in a minute while walking (your walking heart rate). Record the data in the data table. • Repeat all aspects of step number six, this time while running in place (your running heart rate). Record your data. • Repeat steps one through seven with all members of the group and record all data. • Find the average heart rate for each category (resting, walking, and running) by adding the members’ heart rates and dividing by the number of individuals in the group. • Using the grid below the data table or Microsoft Excel, create a bar graph illustrating your average data.