Download
1 / 21
210 likes | 225 Vues
The largest evaluation in Illinois to date, assessing treatment outcomes of 1,890 adult clients from 40 programs in various care levels. Includes data on Addiction Severity Index, follow-up interviews, and improvements in physical and mental health, relationships, and public aid system use.

E N D
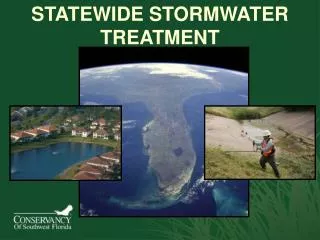
ILLINOIS STATEWIDE TREATMENT OUTCOMES PROJECT
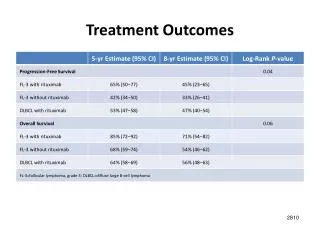
Illinois Statewide Treatment Outcomes Project • Largest evaluation of treatment outcomes by the • State to date • 1,890 adult clients recruited from 40 treatment • programs across the state • Three levels of care were sampled: Residential • Rehabilitation (RR), Intensive Outpatient (IOP), • and Outpatient (OP). The study also included • clients in Methadone Maintenance (MM) therapy
Illinois Statewide Treatment Outcomes Project • Addiction Severity Index (ASI) was administered • at intake by program staff • Follow-up ASI was administered 6 months after • intake by research staff • Follow-up interview was attempted with all • clients, even if they never began receiving • services (“intent to treat” methodology) • 1,210 clients completed the follow-up interview • (65% of those who completed baseline)
Graph 1 Gender
Graph 2 Race/Ethnicity
Graph 3 Level of Care
Graph 4 Chronic Health Problems by LEVEL of CARE
Graph 5 Reported Lifetime Abuse by GENDER
Graph 6 Admissions Prompted By the CRIMINAL JUSTICE SYSTEM
Graph 7 Clients Remaining in Treatment
Graph 8 Treatment Completion Status
Graph 9 Percent Using in PAST 30 DAYS
Graph 10 Average Days of Using in PAST 30 DAYS
Graph 11 Percent Using Alcohol in PAST 30 DAYS
Graph 12 Percent Using Marijuana in PAST 30 DAYS
Graph 13 Percent Using Cocaine in PAST 30 DAYS
Graph 14 Percent Using Heroin in PAST 30 DAYS
Graph 15 Employment Problems in PAST 30 DAYS
Graph 16 Percent Reporting Income from Various Sources
Improvements in Other Areas • Reduction in physical health problems • Reduction of mental health problems (depression, • anxiety, suicidality) • Improvements in relationships with family • members and friends • Decreased use of the public aid system: • 10% reduction in use of Medicaid services • 7% reduction in use of Food Stamp services • 25% reduction in use of Cash Assistance (TANF) services
The full report, The Effectiveness of Substance Abuse Treatment in Illinois: Results of the Illinois Statewide Treatment Outcomes Project, can be obtained via the Internet at the following location: www.state.il.us/agency/dhs/reseasanp.html