Elasticity
Elasticity. adding (quantitative) meat to the bones of supply and demand. Suppose the price of gas rises by 10% over the next month. By how much will Ohio drivers cut back on their purchases of gasoline?. 0 percent (no cut back) 1 to 5 percent 6 to 10 percent 11 to 20 percent

Elasticity
E N D
Presentation Transcript
Elasticity adding (quantitative) meat to the bones of supply and demand
Suppose the price of gas rises by 10% over the next month. By how much will Ohio drivers cut back on their purchases of gasoline? • 0 percent (no cut back) • 1 to 5 percent • 6 to 10 percent • 11 to 20 percent • More than 20 percent
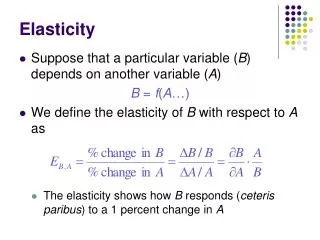
%ΔP %ΔQ Price Elasticity of Demand • Measures the price sensitivity of buyers Ed = $ $3.50 $3.00 D Gasoline 280 300
%ΔP Degree of Sensitivity Elastic: |Ed| > 1 Unit: |Ed| = 1 Inelastic: |Ed| < 1 %ΔQ Midpoint Formula Ed = = Ed = -[.07/.15] = -0.47 $ $3.50 $3.00 D Gasoline 280 300
When the price of milk is $2 per gallon, consumers buy 500 gallons. When the price rises to $3 per gallon, consumers buy only 400 gallons. What is the elasticity of demand and how would you classify it? • -1.81; elastic • -0.55; inelastic • -0.50; elastic • -2.00; inelastic Ed = Ed = -.22/.40 = -0.55
Determinants of Elasticity • Number of substitutes • The greater the # substitutes, the greater the elasticity • The narrower the definition of the market, the greater the elasticity • Ex: • Item’s share of consumer budget • The greater the share of budget, the greater the elasticity • Ex: Ehousing > Esalt Ecars < Echevys < Ecamaros < Ebitch’n camaros
Determinants of Elasticity • Time • The longer the time horizon, the greater the elasticity $ Gasoline Demand: ELR > ESR P1 P0 D1 long run D2 short run Q1 Q2 Q0 gasoline
Extreme Cases of Price Elasticity D1 $ • Perfectly Inelastic • Ed = • Examples? • Perfectly Elastic • Ed = • Examples? P2 0 P1 Q Q1 $ ∞ D1 P1 Q
Some Estimated Price Elasticities of Demand GoodPrice elasticity • Inelastic demand Eggs - 0.10 Beef - 0.40 Stationery - 0.50 Gasoline - 0.50 • Elastic demand Housing - 1.20 Restaurant meals - 2.30 Airline travel - 2.40 Foreign travel - 4.10
Suppose that the price elasticity of demand for a Marietta College education is estimated to be E = -0.80. Based on this information, if the college were to raise tuition by 5%, then: • enrollment will fall by 6.25% and tuition revenues will increase. • enrollment will fall by 4% and tuition revenues will increase. • enrollment will fall by 6.25% and tuition revenues will decrease. • enrollment will fall by 4% and tuition revenues will decrease.
Elasticity and Total Revenue • Elastic Demand • P x Q = TR • P x Q = TR • Inelastic Demand • P x Q = TR • P x Q = TR TR = P x Q TR = $200,000 $ E = - 1.82 $1000 TR = $240,000 $800 E = - 0.55 $600 $400 D 200 300 400 500 Computers
Suppose that the price elasticity of demand for a Marietta College education is estimated to be E = -0.80. Based on this information, if the college were to raise tuition by 5%, then: • enrollment will fall by 6.25% and tuition revenues will increase. • enrollment will fall by 4% and tuition revenues will increase. • enrollment will fall by 6.25% and tuition revenues will decrease. • enrollment will fall by 4% and tuition revenues will decrease.
In August, 1990, East German taxicab drivers were on strike demanding lower cab fares. What must the drivers have believed about the price elasticity of demand for taxi rides? • The demand was elastic. • The demand was inelastic. • The demand was perfectly elastic. • The demand was perfectly inelastic.
According to recent studies at M.I.T. and the University of Michigan, a 10% increase in the price of cigarettes leads to a 14% drop in sales to teenagers. What is the elasticity of demand for cigarettes among teenagers? • -0.71 • -1.40 • +1.40 • +0.71 Would you expect it to be this high for older smokers? Explain.
Cigarette Tax Revisited S2 Assume that ED = -0.60 price S1 ED = = -0.60 4.40 %ΔP = 10% 4.00 t = $1 %ΔQD = - 6.0% 3.40 D1 What happens to total consumer expenditures? cigarettes 27.4 25.8 %ΔQD = - 6% What happens to tax revenue if demand becomes more elastic?
Other Demand Elasticities • Cross-Price Elasticity • Exy = • Income Elasticity • EI = Substitutes: Exy > 0 Complements: Exy < 0 Normal Goods: EI > 0 Inferior Goods: EI < 0
In Marietta, the price elasticity of demand for bus rides is ED = -0.5, the income elasticity of demand for bus rides is EI = -0.1, and the cross elasticity of demand for bus rides with respect to gasoline is Exy = 0.2. a) Is the demand for bus rides elastic or inelastic with respect to the price of a bus ride? How do you know? b) Would an increase in bus fares increase the bus company's total revenue? Explain your answer. c) Describe the relationship between bus rides and gasoline. Explain your answer. d) If the price of gasoline increases by 10 percent with no change in the price of a bus ride, by what percentage will the number of bus rides change? e) If incomes in Marietta increase by 5 percent with no change in the price of a bus ride, by what percentage will the number of bus rides change? f) In Marietta, is a bus ride a normal good or an inferior good? Why?