Download
1 / 33
330 likes | 505 Vues
Defaults on Municipal Bonds. Mandy Swanson. Overview. Historic Default Rate Orange County Washington Public Power Supply System Conclusion . History of Defaults. From 1940-1999 default rate only 1.1% 1920’s, 1930’s (depression), 1980’s, and 1990’s Orange County – 1994 WPPSS - 1982.

E N D
Defaults on Municipal Bonds Mandy Swanson
Overview • Historic Default Rate • Orange County • Washington Public Power Supply System • Conclusion
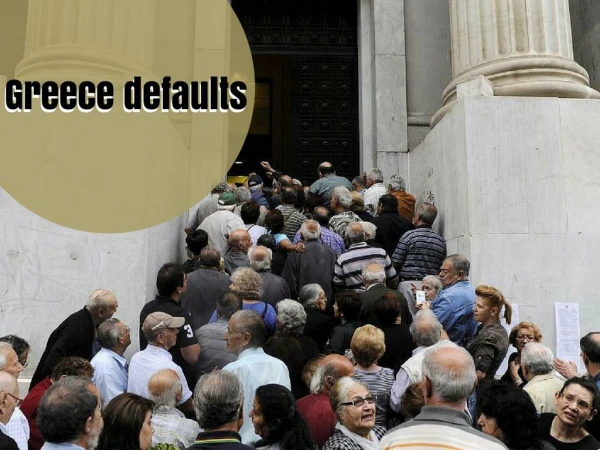
History of Defaults • From 1940-1999 default rate only 1.1% • 1920’s, 1930’s (depression), 1980’s, and 1990’s • Orange County – 1994 • WPPSS - 1982
Orange County, California • Not only the place for a hit TV shows and Movies…. • Home of the Largest Municipal Bond Default in History
Background: • Wealthy and politically conservative county. • The pool handled funds on behalf of 194 public bodies • Traditional Bond Pools invest in low risk securities.
Robert L. Citron, Treasurer • Risky Investments • Big Bets, Gone Bad • Interest Rates Decrease: GOOD! • Interest Rates Increase: BAD!!
Players in Downfall: • Repos (Repurchase Agreement) • Contract between seller and buyer that stipulates the sale, and later repurchase, of securities at a specific date and price. • Example: take a loan out on the house, put the house up, and repurchase house later for a price that includes loan amount, plus interest.
Reverse Repos: • Reverse Repos • The dealer (buyer) trades money for securities, agreeing to resell them later. • It’s a way for seller to get additional funds • OC repos spanned 3-6 months. • The newly invested bonds pays a coupon that is higher than the repo interest rate. • Earn money on margins, IF interest rates go down or stay constant.
Reverse Repo Example: • OCIP sells bond to dealer (CSFB), repurchase 30 days at fixed price. Coupon rate of bond is 5.38% • CSFB would then sell the bond to another client. • OC received $100 million for bond. Repo rate= 3% APR for 30 days. • Interest: • 100 Million X 3% * (30/360) = $250,000 • End payment would be $100,250,000. • In meantime, OCIP invest back in another bond with coupon payment of 5.38% (that’s an earnings margin of 5.38% - 3.0% = 2.38%!) • 100 million X (5.38-3.00)* (30/360) = 198,333
Reverse Repo: • Profitable if interest rates go down or stay the same, lose money on the margin if interest rates go up. • Rates low Citron, in 1991, he had a leverage of 3 to 1 on reverse repos: • Total Exposure: 300M = Initial Note (100M) + First Reverse RP (100M) + Second Reverse RP (100M)
What if interest rates go up? • Interest rate risk: interest Increase then securities price decreases. • If rates go up to 7.88% (from 5.34%) the prices of securities drop well below $100 dollar par value • OCIP Exposure: 3X the original amount with interest increase • One Repo drops price from $100.00 to $95.80 • Second Repo drops price further to $87.40 • Citron promised to buy back at $100.00, can only sell his bonds for $87.40.
Repos can be rolled over: • If rates go up, the dealer will request additional funds as collateral. • To roll over, if borrowed $100 Million in bonds, and value of the bonds fell $8 Million, then the dealer would ask for additional $8 Million as collateral. • With OCIP • Dealer 1 requests $8 Million • Dealer 2 requests $8 Million. • Total = $16 Million to rollover Repos. • OCIP had to come up with over $515 million to roll over Repos. • OCIP failed to meet the rollover call prices.
Players in Downfall: • Derivatives: assets that derive from that of some underlying assets. • The return on a derivative is linked to the performance of the underlying asset (bond, currency, commodity). • Derivative examples: Options, Swaps, Futures contracts, and Forward Contracts. • Derivatives: highly exotic, unregulated, misunderstood.
Players in Downfall: • Structures Notes: • Inverse floaters: where if interest rates go down, coupon payment goes up • Very sensitive to movements in interest rates • OC took tons of Inverse Floaters from agencies such has Fannie Mae. • Basically took these notes betting on stable or falling interest rates.
Pool Performance:Before 1994 OC pool was performing better than state pool. ($755 million better) • Everyone wanted “in” Few were skeptical • Citron was even re-elected
Interest Rates: Federal Reserve Bank Raised Interest to combat inflation in 1994.
What did Citron Do Early 1994?? • Even after rates started to rise. • First: Citron leveraged portfolio more with another $12.6 billion worth of repos, then invested that money in other notes and bonds. • Second: increased leverage further by buying about $8 billion in structured notes. • “Double Up” Strategy
Investor Scare: • Investors pulled money out • Cash flow decreased
Results: • 1.7 BILLION! LOSS and County Bankruptcy • That is more money than the GDP of many small nations!
Results? • 1996 Recovery Certificates • Lowered Credit Rating • Cut Expenses (layoffs, public service cuts) • So Far the county has recovered about $680 Million • Government has passed legislation to prohibit bond issuers from dealing in options when making investment.
John M. W. Moorlach, CPA • Citron Resigned • New Treasurer, has instituted new policies for investment pools
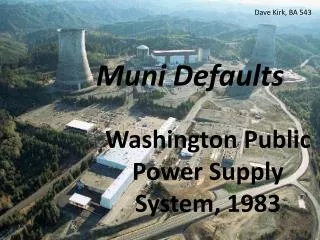
WPPSS Background: • Established in 1954 to Build Power Generation Facilities • Predicted that demand for electricity would double every 10 years. • Plan for 5 Plants
Problems: • Inflation • Design changes • Safety changes • Mismanagement • Investor Skepticism
Management: • Responsible for cost increases and schedule delays. • Growth threshold challenges • Organizational size and structure was not changed to accommodate the growth of the plants • Slow delegation to lower levels (lower management were underdeveloped and underutilized. • Tradition to promote from within and familiar people, rather than recruit top executives with experience.
Board of Directors: • Small time directors, who were successful only in smaller businesses. • Types of Members: • Wheat ranchers, apple orchard owners, veterinarians, muffler shop owners, and refrigerator salesmen. • One a few were professional, and of those virtually none had any high level managerial experience with nuclear power. • At meetings, in a 2 hour meeting only about 3 minutes was devoted to policy considerations.
Planning and Budgeting: • Budget emphasized financial control and accountability rather than planning and performance. • Decisions made without serious consideration of goals. • Budget reductions made with no regard for in- put from department managers or department goals. • Typical budget policy of a much smaller organization. • Lack of central coordination of the budget process lead to poor construction cost data.
Cost Increases: • Labor Costs: higher costs with lower productivity. • Regulatory Changes: 1,000 new regulations in the 1970’s (although not all caused increases in costs) • Contract Increases: if costs of project overrun beyond contactor’s control. (project design changes, schedule revisions, etc)
Plant Production Haulted: • 1982: Plants 4 and 5 halted • Budgets exceeding $24 Billion, and neither made money, or power. • Plants 1 and 3 were never completed either • Losses covered by the Bonneville Power Administration
Results: • Losses of 2.25 Billion, and resulted in system default. • Member utilities, specifically rate payers, were held responsible to pay back money.
Lawsuit: • Bondholders Sued…. • 30,000 bondholders got $0.40 on the dollar, and the rest received as low as $0.10 on the dollar.
Conclusion • Even though defaults are rare, when they do occur they have significant impacts. • Promotes Diversification!!! • Can get insurance to help cover the chance of defaults, this insurance basically lowers coupon payments slightly.