Download
1 / 24
240 likes | 383 Vues
Disinfection and Supply Changes to Improve Quality & Quantity In Kentucky American’s Northern Division*. Joint Water Professionals Conference ~ KY-TN AWWA & WEF~ Covington, Kentucky, September 13, 2005 By Jan Routt, Jan Routt & Associates, LLC

E N D
Disinfection and Supply Changes to Improve Quality & Quantity In Kentucky American’s Northern Division* Joint Water Professionals Conference ~ KY-TN AWWA & WEF~ Covington, Kentucky, September 13, 2005 By Jan Routt, Jan Routt & Associates, LLC Richard Svindland, American Water Southeast Region David Shehee, Kentucky American Water *adapted from original presentation—photos and other content omitted for file size reasons.
Presentation Overview • Will describe decision making for changes for multiple objectives • Provide adequate supply • Maintain disinfection and over all water quality • Disinfection byproduct control • …. Using multiple sources of supply with different disinfectants (chloramines and free chlorine) in a hydraulically challenging area • Nitrification control, detection and remediation
Step one (enhancing coagulation at lower pH) 30% 51% 22% 40% KMnO4 demand & dosing caustic feed enhanced alum & ferric No pre-lime
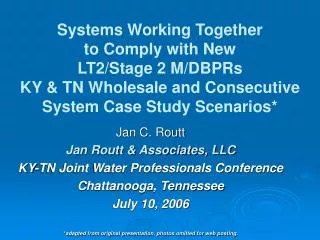
Consecutive Systems = “joint” responsibility for DBP formation and control • THM/HAA compliance = average of four sites per “joint” (or combined) system
Step two treatment changes –Intermediate chlorination • Intermediate chlorination • State approval • With substantial monitoring 59% 50%
Decision to convert to chloramines ~ a phased approach over several months/years -- with conversion to chloramines as the last step • Profile Disinfection, DBP formation and precursor removal through plant and system—State approvals-- and lots of testing to confirm water quality-- all along the way! • Optimized preoxidation (KMnO4—reliable feed, dosed for source demand) Written SOPs/testing. Added post pH adjustment (caustic) for corrosion control, enhanced coagulation with alum/ferric at lower treated pH (no more lime in pre-treatment). Written SOPs/testing • 25% >50% TOC removal, THMs reduced by ~15% • Move chlorination point from rapid mix to pre filters—two feed points just before and after filters. Written SOPs/Testing • THMs & HAAs reduced to half the previous level • Optimize distribution operations!
Reductions in THMs and HAAs to this point have been a result of plant modifications. Distribution system optimization and future plant changes will help us meet future regulations while maintaining an ample supply of water. Compliance is tenuous at best—Surveillance testing and operations controls critical Limits
Kentucky American TriVillage working to improve water quality & lower DBPs, maintain current supplies and increase supplies to underserved areas. • Due to expanding water supply needs, the team/project has grown to include new suppliers — Georgetown (and suppliers Frankfort, KAW Central) and Gallatin Co/Warsaw and Carroll Co.
Purchaser: KAW Northern TriVillage water purchased & rechlorinated Suppliers: Gallatin Co (Warsaw) & Carroll Co GW & free chlorine Supplier: Owenton ~ SW & free chlorine Georgetown/Frankfort/KAW Lex ~ SW & chloramines
Poor Turnover when using Chloramines Leads to Water Quality Problems in the Distribution System
Nitrification- a microbial biofilm process where ammonia is the nutrient • Ammonia is released as chloramines degrade (autodecomposition) • NH2Cl + H2O HOCL + NH3 Hydrolysis • 2NH2Cl + H+ NH4+ + NH2Cl Lower pH speeds up autodecomposition • 3NH2Cl N2 + NH3 + 3HCL Net decay reaction via autodecomposition • Ammonia Nitrosomonas Nitrite Nitrobacter Nitrate • Nitrite + Chloramine faster decomposition more ammonia…..
Decision making processes, studies, design and operations in converting chloraminated water to free chlorinated with distribution booster chlorination • Operations plan to • define low flow areas • minimize water age, degradation and disinfection byproducts • optimize flushing and blow off locations and volumes • Need to blend or alternate water supplies to supplement flows from Owenton source in drought conditions (will also be helpful when current Owenton intake is being modified) • Georgetown does not annually convert to free chlorine for nitrification control and supplies higher chloramine residual at master meter. KAW water about 1.0 ppm less total chlorine & greater water age of different general quality —alk, TOC, and pH • Need to maintain chlorine residual to ends of system from either source so sited chlorine booster at master meter
Breakpoint Chlorination • The presence of organic nitrogen compounds also will increase the chlorine demand and increase the Cl2:NH3-N ratio at breakpoint. Therefore, while the theoretical chlorine dose required to reach breakpoint can be estimated, competing side reactions and the presence of nitrite and/or organic nitrogen compounds, such as proteins and amino acids, make calculation of the actual breakpoint of an individual water difficult. It is recommended that bench-scale studies be performed when it is necessary to know the actual chlorine dose required to reach breakpoint in a specific water to be treated. – Optimizing Chloramine Treatment, 2nd Edition.
DBP FP Studies at Interconnection Point – tedious, time-intensive
Zone for potential variable supply if chlorine same Free Chlorine Groundwaters Very low TOC & DBPFP Higher hardness Chloramines Plentiful Surface Water Lower TOC & DBPFP Nitrification Booster Chlorine feed for free Chlorine Free Chlorine Limited Surface Water Higher TOC & DBPFP
Acknowledgements The authors acknowledge the field sampling and analysis work of Kentucky American Lab Analyst, Shana Carr, in the nitrification, disinfection byproduct formation potential, and breakpoint chlorination studies presented here, as well as the hard work of all Kentucky American and Owenton staff involved in diligently, comprehensively monitored operations over the last five years. Support and technical assistance from Kentucky American and American Engineering, and Kentucky Division of Water have been key to success, along with ongoing cooperation of all local officials in Owenton and Owen and surrounding counties.