Download
1 / 26
260 likes | 416 Vues
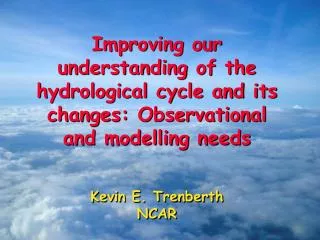
Layer Precipitable Water (LPW) Briefing. 6 March 2013. Introduction. Water vapor is important for several forecasting problems, especially precipitation. Forecasters frequently use two remotely sensed products:

E N D
Layer Precipitable Water (LPW) Briefing 6 March 2013
Introduction • Water vapor is important for several forecasting problems, especially precipitation. • Forecasters frequently use two remotely sensed products: • Total Precipitable Water (TPW) from either microwave retrievals or GOES Sounder (infrared) retrievals • GOES 6.7 m imagery
6.7 mm Imagery • Shows 6.7 mm brightness temperature, which is related to upper-level water vapor (~500-300 hPa) • Also shows clouds which penetrate to these levels or higher
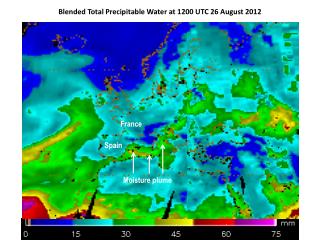
Total Precipitable Water (TPW) • Shows total water vapor (in millimeters) in the atmospheric column from the surface to the top of the atmosphere.
Deficiency (of TPW & 6.7 mm) • Very little information about vertical distribution of water vapor • TPW has zero information about vertical distribution of water vapor, it is just the column total. • The GOES 6.7 mm data approximately senses the 300–500 hPa layer, but it senses higher in moist regions and lower in dry regions.
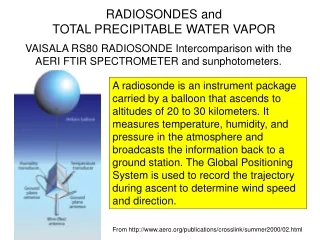
MIRS • Microwave Integrated Retrieval System • Retrieves many variables from microwave sounding instruments (Boukabara et al. 2011) • Uses 1DVAR (e.g., Rodgers 2000) retrieval scheme to retrieve atmospheric conditions at 100 levels plus surface conditions. • Mixing ratio is one of the retrieved parameters. This can be integrated to yield the precipitable water in atmospheric layers (LPW) • Retrievals through clouds • Operationally produced by NOAA / NESDIS
Layer Precipitable Water (LPW) • We integrate the MIRS mixing ratios to yield Layer Precipitable Water:where q is mixing ratio, p is atmospheric pressure, g is gravity, ptop is the pressure at the top of the layer, and pbottom is the pressure of the bottom of the layer. (pbottomis no greater than the surface pressure, psfc. )
Layer Precipitable Water • Five layers are chosen • Surface to 850 hPa • 850 to 700 hPa • 700 to 500 hPa • 500 to 300 hPa • TPW (surface to top of atmosphere) • psfc is a function of surface elevation only; it does not change with changing weather conditions. • If psfc is less than 850 hPa but greater than 700 hPa, then the bottom layer is missing (black) and the 850 to 700 hPa layer is calculated from psfcto 700 hPa.
Example 500-300 hPa layer not shown 700-500 850-700 Atmospheric River Sfc - 850 TPW 21Z 28-Feb-2013
Satellites Notes The actual observation time is within about ½ orbit (50 min) of the above times. AIRS retrievals only in clear areas
Compositing • Program runs every 3 hours at 00Z, 03Z, …. • Data for the last 12 hours are plotted with the newest observation on top (covering up older observations) • There is a 1-2 hour gap between the time on the image and the latest satellite data due to the time it takes to transmit the data to the ground, do the retrievals, and make the composites.
Strengths and Weaknesses • The primary strength of these products is that they have vertical resolution, as opposed to TPW products, which are for the whole atmospheric column • Other strengths and weaknesses are similar to Blended TPW. • AIRS retrievals (infrared) are somewhat different than microwave retrievals, and sometimes appear to add noise to the images.
Potential Uses of LPW (1) AREA FORECAST DISCUSSION NATIONAL WEATHER SERVICE PORTLAND OR 929 AM PST TUE MAR 5 2013 ...MODELS CONTINUE TO INDICATE MOST OF THE LOW LEVEL MOISTURE GETTING WRUNG OUT BY THE SISKIYOUS LEAVING MUCH OF THE DISTRICT UNDER SOMEWHAT OF A RAIN SHADOW.
Potential Uses of LPW (2) AREA FORECAST DISCUSSION NATIONAL WEATHER SERVICE PHOENIX AZ 910 AM MST MON MAR 4 2013 ...THE BULK OF THE THICKER UPPER LEVEL SUBTROPICAL MOISTURE HAS MOVED EAST OF THE AREA THIS MORNING...AS A SHEARED SOUTHERN STREAM WAVE TRANSLATES INTO NEW MEXICO AND THE MAIN PV ANOMALY SINKS SOUTH INTO SRN NEVADA...FURTHER DISPLACING THE MOISTURE PLUME AWAY FROM THE FORECAST AREA. ...GIVEN THE BROAD SWLY FLOW AND LIKELIHOOD OF TAPPING EXTENSIVE UPPER LEVEL SUBTROPICAL MOISTURE ONCE AGAIN...HAVE GENERALLY NARROWED THE FORECAST DIURNAL RANGE...ESPECIALLY WITH RESPECT TO HIGHS
Potential Uses of LPW (3) AREA FORECAST DISCUSSION NATIONAL WEATHER SERVICE SAN DIEGO CA 823 PM PST SUN MAR 3 2013 ...IR SATELLITE IMAGERY AT 03Z SHOWS LOWER MARINE CLOUDS ARE DEVELOPING OVER THE COASTAL WATERS AND SPREADING LOCALLY INLAND. THE 00Z MIRAMAR SOUNDING SHOWED A PW JUMP TO JUST OVER ONE-HALF INCH. THE MOIST LAYER WAS BETWEEN 8K AND 13K FT.
Potential Uses of LPW (4) AREA FORECAST DISCUSSION NATIONAL WEATHER SERVICE ALBUQUERQUE NM 1044 PM MST SUN MAR 3 2013 ...THE UPPER RIDGE FLATTENED-OUT OVERNIGHT AND WESTERLIES HAVE OVERTAKEN OUR AREA WITH PACIFIC MOISTURE ADVECTION IN THE MID AND UPPER LEVELS OF THE ATMOSPHERE RESULTING IN CLOUDS.
Potential Uses of LPW (5) And then there are Atmospheric Rivers….
What We Hope to Learn During This Evaluation • The operational value from having LPW information to analyze atmospheric river events and compare to model initialization • Other new-found LPW applications, not previously realized • LPW suite value over only having TPW and GOES 6.7m data • Input from users on how to make the products more useful in operations. For example by selecting different layers, calculating different variables (e.g., RH), or comparing with climatology (e.g., percent of normal).
Example of potential product: Tropospheric relative humidity profiles from satellite and model forecasts. • Compare to what is available from radiosondes. Near-realtime display at: http://cat.cira.colostate.edu/sport/layered/blended/profile_zoom1.htm
References • Boukabara, S.-A., et al., 2011: MiRS: An All-Weather 1DVAR Satellite Data Assimilation and Retrieval System. IEEE Trans. Geosci. Remote Sens., 49, 3249-3272. • Rogers, C. D., 2000: Inverse Methods for Atmospheric Sounding: Theory and Practice. World Scientific, Singapore, 238 pp.