Download
1 / 29
310 likes | 490 Vues
An Infrastructure for Hydrogen Fuelled Vehicles. ”Car of the Future”, Trondheim 2. October 2002. Vice President Ivar Hexeberg Ivar Hexeberg@hydro.com. Themes for this presentation. Key drivers and barriers for a change to hydrogen and fuel cells. Infrastructure solutions

E N D
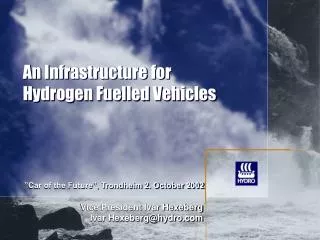
An Infrastructure for Hydrogen Fuelled Vehicles ”Car of the Future”, Trondheim 2. October 2002 Vice President Ivar Hexeberg Ivar Hexeberg@hydro.com
Themes for this presentation • Key drivers and barriers for a change to hydrogen and fuel cells • Infrastructure solutions • Vision and current alternatives • Challenges and Roadmaps • Norsk Hydro’s involvement
Key drivers and barriers for a change to hydrogen and fuel cells Key Drivers Potential Barriers / Challenges • Security of energy supply • Diversification • Sustainable H2 production • Infrastructure solutions • Standards & regulations • H2 supply in transition period • Environmental • concerns • Global warming • Local emissions • Public acceptance • Safety perception • Convenience • Governmental policies & Industrial structure • Inter industry collabotation • Regulations to favour H2? • Competition • Uncertainty • Improvement in traditional and new fuels and technologies • Technological development • Reduced fuel cell costs • Compact H2 storage
Oil production and demand 2000 – 2030 Production Demand Source: IEA – World Energy Outlook 2002
World Primary Energy demand expected to increase by about 66% untill 2030 2000 2030 66 % 9179 Mtoe 15 267 Mtoe Source: IEA – World Energy Outlook 2002
The Transport Sector accounts for an increasing share of CO2-emissions Source IEA: Transportation and Energy, 2002 * * figures from Outlook 2000
Air pollution in urban areas in 2001 Emissions from vehicles is the major source to urban air pollution. Present and future air-quality limits are and will be exceeded in spite of new clean conventional technology. The reason is increased transport. Year average value 2001 EU- Limit NO2 within 2010 EU- Limit PM10 within 2010 Source: Health dept. of Oslo
DAIMLERCHRYSLER Bundesministerium für Verkehr, Bau- und Wohnungswesen Governmental policies and industrial co-operation Example: German Transport Energy Strategy (TES) Objective: • Agree on 1 or max. 2 alternative fuels • for passenger cars and duty vehicles • still under consideration: NG, Methanol, Hydrogen • Fuel shall be • independent of crude oil as far as possible, • supply 30% of market • enable its production from renewable sources on a large scale, • reduce the emissions of pollutants and CO2 over the entire fuel chain • be applicable for a large spectrum of propulsion systems (e.g. internal combustion engine, fuel cell).
Hydrogen safety perception Fire from tank leakage after 1 minute – Hydrogen vs. Gasoline (Source: ”Fuel Leak simulation, DOE proceedings 2001”)
A Vision of the Sustainable Vehicle Fuel O2 O2 Renewable Power Electrolysis Fuel cell vehicle H2 H2O H2O
Sustainable Energy Carriers Fossil fuels • Energy conversion issues: • costs • efficiency/heat util. • CO2 emissions • Renewables • wind • solar • hydro Power plant Reforming Fuel cell El H2 Electrolysis • Energy carrier choice • transport cost/loss • storage cost/loss Bio & Waste
When do we need the infrastructure? Demonstration Transition Market penetration 2015 2005 • 10 – 50 cities in Europe • 10 – 50 cities in USA • 10 – 50 cities in Asia • 10% of filling stations to launch marketing of hydrogen driven passenger cars • Significant growth in market for infrastructure components and hydrogen gas supply
Current alternatives for hydrogen supply Large scale hydrogen production To fueling stations with tube truck as either CH2 or LH2 To fueling stations with pipelines from central production unit Local hydrogen production • Other alternatives: • H2 from ammonia • H2 from methanol On-site water electrolysis on fueling station based on electricity and water On-site natural gas reformering on fueling station
Syngas production and hydrogen production Oil field Large scale hydrogen production with CO2 handling Hydrogen to energy markets Separating of oil, CO2 and produced water CO2 pipeline to oilfield CO2 Injection unit for CO2 Oil to shore Pipeline from offshore gas field Gas field
High pressure electrolysers CAPACITY: 10 – 60 Nm3/h ENERGY CONSUMPTION: 4,8 +/- 0,1 kWh/Nm3 PRESSURE: Direct from electrolyser: 15 bar g PURITY: Direct from electrolyser: 99,9 +/- 0,1 % After purification: 99,9998 % Water Electrolyser, 60 Nm3/h
Hydrogen filling station – Ex.: Iceland • Complete filling station including • Hydrogen generator • Compressor • Storage • Dispensing unit and control Artistic view - preliminary
250 *Atmospheric PEM fuel cell Diesel with regenerative braking Highway effy = 40% (HHV) City effy = 60% (HHV) 200 NG via Hydrogen to fuel cell* 150 Highway CO2 emissions g/km City 100 50 0 Distributed Large SMR - Large SMR - NG Diesel Diesel SMR H2 pipe H2 liq. electricity - hybrid electrolysis CO2 emissions – Well to Wheel
Infrastructure challenges (1) • What is the most economic infrastructure development? • Impact on environment, security and other issues included in assessment • Close co-operation with car industry necessary • Optimal hydrogen fuel choice - liquid or gas (pressure?) • Build up of fuel requirement - how many vehicles to be supported, when and where? • Technology challenges: • Compactness of on-site filling stations • Cost reductions - components, systems, standardisation • Conversion of natural gas pipelines to hydrogen?
Infrastructure challenges (2) • Infrastructure will be capital intensive - irrespective of infrastructure choice • Low initial utilisation = lousy investment • How shall investors be compensated? • How does society secure infrastructure investments? • Authorities and industry need to co-operate • Secure public acceptance of new vehicles and fuels • Convenience, purchaser certainty & safety perception • Establish harmonised regulations & standards • Create financial incentives for investors - f.ex. through reduced/differentiated fuel taxes • Secure resources for research and demonstrations • Definition of common road maps
European Roadmap for H2 vehicles and infrastructure – Germany as example Offshore Wind Solar Energy Technology Advancem. Advanced LH2 70 Mpa CGH2 Solid State H2 e.g. Carbon 10-15 >100 X00 >X,000 >X00,000 ICE Vehicles 10-20 >20 >X,000 >X0,000 >X00,000 >X,000,000 FC Vehicles 15 fleet stations 90 fleet stations 700 stations 1450 stations 6000 stations Refueling Stations 2000 2005 2010 2015 2020 Source: LBST (TES Scenario)
CUTE - Clean Urban Transport for Europe:Hydro participates in the first major demonstration projects in Europe CUTE: 28 partners in 9 cities Total Budget: 52,4 mill Euro EU support: 18,6 mill Euro Project period: 12/2001 - 05/2006 Hydro: WP leader Quality & Safety ECTOS- 3 busses in Røykavik CUTE, Clean Urban Transport for Europe 27 busses in 9 cities Hydrogen production Hydrogen filling stations Operation of fuel cell busses
DaimlerChrysler will deliver the fuel cell buses for CUTE/Ectos
Hydrogen supply for the transportation sector Norsk Hydro’s electrolysers offer an immediate solution to the demand for a hydrogen infrastructure.
Development of new high performance electrolysers Gesellschaft für Hochleistungselectro- lyseure zur Wasserstofferzeugung Norsk Hydro Electrolysers AS 40 % MTU, Friedriechshafen 40 % Hamburgische Electricitätswerke 20 % Some targets for new generation: Operating pressure : 30 bar g Operating temperature : 80 °C Active area : 2 m2 Max. no cells in one stack : 70 Max. prod. capacity : 460 - 574 Nm3/h Operational range : 10 - 100 % Foot print : 2,5 x 2,3 x 3,0 m
Transport sector near term R&D tasks • Reduce size & cost of filling station components • More compact hydrogen generators • Fuel flexible systems (natural gas, ammonia, methanol) • Station design and packaging • Safety philosophy on design and operation • Fast filling thermal management
Targets • Replace fossil fuels with H2 • Develop systems for production, storage and distribution of H2 • Test H2 in transport and fishing vessels Íslensk NýOrka ehf (Icelandic New Energy Ltd.)
Power Fuel cell Wind – hydrogen – fuel cell energy system at Utsira Hydrogen system H2-storage Electrolyser
Hydrogen for sustainable energy supply • Hydrogen: A clean energy carrier in a sustainable energy future • Hydrogen and fuel cells: • emits only water • high energy efficiency Society • Hydrogen can be produced from renewable resources Environment Economy • Large scale hydrogen production from natural gas allows removal of CO2
More information contact: Norsk Hydro ASA N - 0240 OSLO + 47 22 53 75 84 ivar.hexeberg@hydro.com www.hydro.com www.electrolysers.com