Download
1 / 58
580 likes | 680 Vues
Learn how a culture of inquiry can enhance student outcomes with user-friendly data access, collaborative dialogue, and evidence-based decision-making framework. Discover the stages of an applied inquiry framework for student completion.

E N D
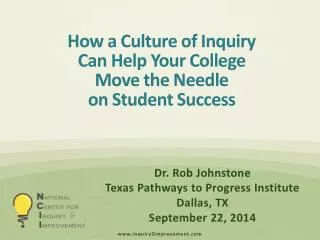
How a Culture of Inquiry Can Help Catalyze Completion Efforts Dr. Rob Johnstone Ohio Board of Regents Charting the Course for Student Completion Columbus, OH December 3rd, 2013
An Applied Inquiry Framework for Student Completion – April 2013 Acknowledgements • Much of the content in this presentation in conjunction with national projects such as Completion by Design, the Aspen Prize for CC Excellence, and Bridging Research, Information & Cultures (BRIC) • Content has also been developed by and with a host of national partners, including: • Community College Research Center (CCRC) • Jobs for the Future • JBL Associates • Public Agenda • The Research & Planning (RP) Group • WestEd • Infographics were primarily designed by Greg Stoup
April 2013 The Student Experience An Applied Inquiry Framework for Student Completion
April 2013 A Culture of Inquiry & Action A RESOURCE for INSTITUTIONAL change
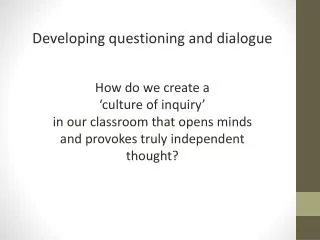
What is a Culture of Inquiry? Institutional capacity for supporting open, honest and collaborative dialogfocused on strengtheningthe institution and the outcomesof its students.
Culture of Inquiry: Features • Widespread access to user-friendly information on student outcomes • Encouraging more people to ask a wider collection of questions and use their evidence and conclusions to enhance decision making • Reflective and dynamic discussions across constituency groups
Culture of Inquiry: More Features • Continuous feedback so adjustments can be made along the way and processes can be adapted • A sense of ownership over improving student outcomes – not blaming the student • Using insight generated from inquiry to act at varying levels of the institution to create the conditions to improve outcomes
Applied Inquiry Framework for Student CompletionDeveloped for Completion by Design A Resource for Institutional Change
An Applied Inquiry Framework for Student Completion • Stage 1 – Explore how to improve outcomes • Stage 2 – Gather meaningful evidence • Stage 3 – Discuss evidence broadly • Stage 4 – Use evidence to inform change • Stage 5 – Measure the impact of change
Explore how to improve student outcomes STAGE 1 Focus inquiry on designing approaches that improve student outcomes
Key Questions • When was the last time you sat in a standing committee meeting on your campus that used evidence to explore a key student success outcome for more than 20 minutes? • What types of questions do we spend most of our organizational resources answering?
Gather meaningful evidence STAGE 2 Collect high-quality, meaningful evidence at the student support, classroom, program, and institutional levels
When gathering evidence, make sure you are focusing on the right data…
20 year trend for California CCcourse success & persistence rates Persistence Rate Success Rate What does that tell us about the usefulness of these metrics in setting institutional strategies? 1989 2008
Three Studies to Energize a Campus Conversation About Student Success • Grades & Success in Sequenced Courses • Cohort Tracking in Developmental Education • Levels of Preparedness in GE Courses – success of simultaneously enrolled students in Math / English courses
Study 1: Grades in Sequenced Courses Note: Data tracked from 2006-07 to 2011-12
Grades in Sequenced Courses Backdrop • Course sequences analyzed in Mathematics, English, Biology, Chemistry, Physics & Economics • Relationship between grade in 1st course in sequence and success in 2nd course in sequence was examined. • Enrollment data tracked from 2006-07 to 2011-12 • Cohort Ns ranged from 1,890 to 126,367
Developmental Education Math Course Sequence Pre-Algebra Introductory Algebra Introductory Algebra Intermediate Algebra Transfer Level Math 306 Math 308 Math 308 Math 310 Math 1300s The grade received by students in Math 306 Success Rate of those same students in Math 308 100% 90% A A 76% 80% 70% Those placing directly into Math 308 60% 60% 51% B B 50% 40% 27% 30% C 20% 10% 0%
Developmental Education Math Course Sequence Pre-Algebra Introductory Algebra Intermediate Algebra Intermediate Algebra Transfer-Level Math 306 Math 308 Math 310 Math 310 Math 1300s The grade received by students in Math 308 Success Rate of those same students in Math 310 100% 90% A A 81% 80% 70% Those placing directly into Math 310 60% 60% 57% B B 50% 40% 37% 30% C 20% 10% 0%
Intermediate Algebra – Transfer-Level Mathematics Intermediate Algebra Transfer-Level Transfer-Level MATH 310 MATH 1300s MATH 1300s The grade received by students in Math 310 Success Rate of those same students in Math 1300s 100% 90% A A 81% 80% Those placing directly into Math 1300s 63% 70% 66% 60% B B 50% 44% 40% 30% C 20% 10% 0%
Calculus Course Sequence Calculus I Calculus II Calculus II MATH 2413 MATH 2414 MATH 2414 The grade received by students in Math 2413 Success Rate of those same students in Math 2414 100% 90% 90% A A 78% 80% Those placing directly into Math 2414 72% 70% 60% 50% B B 50% 40% 30% C 20% 10% 0%
Developmental Education Writing Course Sequence Two Levels below Transfer One Level below Transfer One Level below Transfer Transfer Level English ENGL 306 ENGL 307 ENGL 1301 The grade received by students in English 306 Success Rate of those same students in English 307 100% 90% A A 77% 80% Those placing directly into English 307 66% 70% 66% 60% 49% B B 50% 40% 30% C 20% 10% 0%
Developmental Education Writing Course Sequence Two Levels below Transfer One Level below Transfer Transfer Level English One Level below Transfer ENGL 306 ENGL 307 ENGL 1301 The grade received by students in English 307 Success Rate of those same students in English 1301 100% 90% A A 80% 74% Those placing directly into English 1301 71% 70% 61% 60% B B 46% 50% 40% 30% C 20% 10% 0%
College English Course Sequence Composition I Composition II Composition II ENGL 1301 ENGL 1302 ENGL 1302 The grade received by students in English 1301 Success Rate of those same students in English 1302 100% 88% 90% A A 77% 80% Those placing directly into English 1302 70% 68% 58% 60% B B 50% 40% 30% C 20% 10% 0%
College Biology Course Sequence Biology I Biology II Biology II BIO 1406 BIO 1407 BIO 1407 The grade received by students in Biology 1406 Success Rate of those same students in Biology 1407 100% 90% 90% A A 76% 80% Those placing directly into Biology 1407 70% 70% 60% 60% B B 50% 40% 30% C 20% 10% 0%
College Biology Course Sequence Anatomy Physiology Physiology BIO 2401 BIO 2402 BIO 2402 The grade received by students in Biology 2401 Success Rate of those same students in Biology 2402 100% 88% 90% A A 80% 72% Those placing directly into Biology 2402 70% 67% 60% 50% B B 50% 40% 30% C 20% 10% 0%
College Chemistry Course Sequence General Chemistry I General Chemistry II General Chemistry II CHEM 1411 CHEM 1412 CHEM 1412 The grade received by students in Chemistry 1411 Success Rate of those same students in Chemistry 1412 100% 86% 90% A A 80% 70% Those placing directly into Chemistry 1412 70% 66% 60% B B 46% 50% 40% 30% C 20% 10% 0%
University Physics Course Sequence General Physics I General Physics II General Physics II PHYS 1401 PHYS 1402 PHYS 1402 The grade received by students in Physics 1401 Success Rate of those same students in Physics 1402 100% 94% 87% 90% A A Those placing directly into Physics 1402 80% 78% 69% 70% 60% B B 50% 40% 30% C 20% 10% 0%
Economics Course Sequence Macro Economics Micro Economics Micro Economics ECON 2301 ECON 2302 ECON 2302 The grade received by students in Economics 2301 Success Rate of those same students in Economics 2302 100% 89% 90% A A 81% 80% 74% Those placing directly into Economics 2302 71% 70% 60% B B 50% 40% 30% C 20% 10% 0%
Simple and Effective Analyses to Inform Student Progress and Completion Efforts • Based on analyses from: • Florida State University • Georgia State University • San Diego State University • University of North Carolina – Greensboro • University of Texas • University of Southern California • University of Wisconsin Eau Claire • Virginia Commonwealth University
Simple and Effective Analyses to Inform Student Progress and Completion Efforts Targeting at-risk populations (UNCG) Identifying At-Risk Students Using Historical Data (GSU, FSU) Identifying At-Risk Students Using Milestones (FSU, GSU) Tracking beyond Freshmen to Sophomore Retention Rates (FSU) Tracking Second Year Students with Sophomore Standing (GSU)
Simple and Effective Analyses to Inform Student Progress and Completion Efforts Identifying Correlates of Success (VCU, UWEC, SDSU) Identifying Correlates of Non-Success (USC) Predictive Model for Retention (VCU, GSU) Impact of Course Withdrawals (VCU) Additional Analyses (USC, FSU, GSU, UWEC)
First Year to Second Year Retention, Georgia State University
First Year Retention & Progression Rates - Georgia State University
Discuss evidence broadly STAGE 3 Engage a variety of campus stakeholders in evidence-based discussions about improvements in practice
Data do not speak for themselves.
The vital role of exploration • In order to make data useful, ample time and space are needed to discuss and analyze the information and connect it back to the original research question. • Answers are not always immediately apparent, so skilled facilitation may be needed to dig out the deeper meaning. • Multiple perspectives and types of information are often needed to make sense of individual data points. !
Study 3: • English & Math Preparedness & Success in GE Courses –
Success in Psychology 101 for students simultaneously enrolled in an English course English 826 (Two Below) English 836 (One Below) English 100 (Transfer A) English 110 (Transfer B) Success Rate of those same students in Psychology 101 English course taking profile for students in Psychology 101 100% 90% 75% 80% Not in an English course 68% 70% 64% 60% 48% 50% 40% 31% 33% 67% 30% 20% 10% 0% Note: Enrollments from Summer 2000 to Spring 2009; Success is defined as A/B/C/CR grade
Success in Psychology 101 for students simultaneously enrolled in an Math course Fundamentals Beginning Algebra Intermediate Algebra Transfer Level Math Math course taking profile for students in Psychology 101 Success Rate of those same students in Psychology 101 100% 90% Not in an Math course 76% 80% 70% 64% 63% 60% 51% 50% 43% 40% 37% 63% 30% 20% 10% 0% Note: Enrollments from Summer 2000 to Spring 2009; Success is defined as A/B/C/CR grade
Success in five highly enrolled GE courses by English enrollment level English 826 (Two Below) English 836 (One Below) English 100 (Transfer A) English 110 (Transfer B) Speech 101 Psychology 101 Economics 101 History 101 HSCI 101 100% 90% 88% 82% 82% 80% 79% 75% 74% 73% 73% 70% 68% 64% 60% 60% 57% 56% 54% 51% 48% 50% 48% 43% 40% 31% 27% 30% 20% 10% 0% Note: Enrollments from Summer 2000 to Spring 2009; Success is defined as A/B/C/CR grade
Success in five highly enrolled GE courses by English enrollment level English 826 (Two Below) English 836 (One Below) English 100 (Transfer A) English 110 (Transfer B) Accounting 101 Fitness 334 Music 202 Biology 250 Sociology 101 100% 90% 80% 80% 76% 74% 74% 73% 70% 68% 66% 65% 64% 60% 60% 59% 58% 50% 50% 50% 48% 40% 40% 37% 40% 31% 30% 20% 10% 0% N/A Note: Enrollments from Summer 2000 to Spring 2009; Success is defined as A/B/C/CR grade
Use evidence to inform change STAGE 4 Implement changes in practice and policy based on analyses and discussion of college evidence
Use evidence to guide innovation • In this context, research and applied inquiry are fundamentally interventionist in nature. • We are not seeking absolute truths; rather we are looking for patterns of evidence that inform action-oriented decisions. • Failure can be seen as an opportunity for learning, especially when outcomes are shared and used to inform further improvements in practice.
And what do we do when the evidence is ambiguous? What to do when you reach the limits of your research and yet still face multiple choices? Domain of possible solutions The process of inquiry is not a search for an absolute truth Trust your expertise & choose ! We answer the questions that eliminate dead end solutions Gregory M Stoup, Cañada College
Measure the impact of change STAGE 5 Evaluate the impact of practice changes on student performance