Expanding Medicaid: Addressing Workforce Challenges and Appointment Access
180 likes | 284 Vues
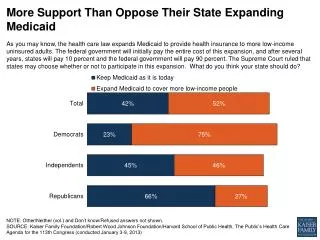
As Medicaid expands under the Affordable Care Act (ACA), the potential for increased access to care may be undermined by a critical shortage of primary care physicians. With 50 million uninsured and 34 million covered by the ACA, the strain on healthcare systems could lead to longer wait times for appointments. States facing restrictive eligibility and low physician supply may experience particularly challenging outcomes. Understanding these workforce dynamics is essential for ensuring timely access to medical care for new Medicaid beneficiaries.

Expanding Medicaid: Addressing Workforce Challenges and Appointment Access
E N D
Presentation Transcript
Expanding Medicaid -- Workforce Challenges Three numbers to keep in mind….. 50 34 16
Expanding Medicaid -- Workforce Challenges Three numbers to keep in mind….. 50= number uninsured (49.9M) 34=number covered via the ACA 16= number covered via the ACA/Medicaid (15.9 M)
Expanding Medicaid -- Workforce Challenges While the ACA will decrease financial barriers to care, another barrier to care – the inability to get timely appointments for ambulatory medical care – could increase for all Medicaid beneficiaries. Why? General worry that increased demand will exceed the capacity of local health care delivery systems, particularly the supply of primary care physicians – mirroring the Massachusetts experience. Physician capacity is a special concern in Medicaid because fewer physicians accept Medicaid patients relative to Medicare and privately insured patients.
Medicaid Today Health Insurance Coverage for 58M 29 million children & 15 million adults in low-income families; 14 million elderly and persons with disabilities Assistance to Medicare Beneficiaries 8.8 million aged and disabled — 19% of Medicare beneficiaries Long-Term Care Assistance 1.4 million nursing home residents; 2.8 million community-based residents MEDICAID Support for Health Care System and Safety-net 16% of national health spending; 41% of long-term care services State Capacity for Health Coverage Federal share ranges 50% to 76%; 45% of all federal funds to states SOURCE: Kaiser Commission on Medicaid and the Uninsured, 2010
More on Medicaid… Total funding (FY 2010) = $488 B (est), plus$83 B more in American Recovery and Reinvestment Act funding in 2009-2010 Benefits are fairly broad, but the supply of providers is inadequate to care for Medicaid beneficiaries in some locations and among some professions. Eligibility is tied to federal poverty guidelines.
Medicaid Coverage of Adults by State Sara Rosenbaum, “Medicaid and National Health Care Reform,” NEJM, 361:21, Nov 19, 2009
Percent of Physicians Accepting All or MostNew Patients, by Type of Insurance Coverage, 2008 SOURCE: Center for Studying Health Systems Change, HSC 2008 Health Tracking Physician Survey, September 2009.
Percent of PCPs Accepting All or Most New Patients, by Type of Insurance Coverage, 2008 SOURCE: Cunningham, Peter J., “State Variation in Primary Care Physician Supply: Implications for Health Reform Medicaid Expansions,” Center for Studying Health Systems Change, Research Brief No. 19, March 2011
Percent of Physicians Accepting No New Patients, by Type of Insurance Coverage, 2008 SOURCE: Center for Studying Health Systems Change, HSC 2008 Health Tracking Physician Survey, September 2009.
What might we expect? Effects will vary by state/region: states with restrictive eligibility requirements and high rates of uninsured residents will be greatly affected by the ACA Medicaid expansion. These states (in the South & West/Midwest) also tend to have the lowest concentration of PCPs. (1) Potential spillover effects to all residents. Inadequate supply and/or maldistribution of physicians may be more of a problem in assuring Medicaid access than low fees – at least, low fees alone. (1) SOURCE: Ku, Leighton, et al., “The States’ Next Challenge – Securing Primary Care for Expanded Medicaid Populations,” NEJM, 364:6, Feb 10 2011.
The Massachusetts Experience… SOURCE: Massachusetts Medical Society 2010 Physician Workforce Study 54% of family medicine physicians are not accepting new patients, and average appointment wait time for new patients is 29 days. For internists, these numbers are 49% and 53 days. The Mass Medical Society classifies both as facing “Critical Shortages” – in both cases an improvement from “Severe Shortage” classifications in 2006-2007 for family medicine physicians and in 2009 for internists. For pediatricians, the shortage is less pronounced: 80% and 24 days.
And What of Pennsylvania? SOURCES: (1) Cunningham, Peter J., “State Variation in Primary Care Physician Supply: Implications for Health Reform Medicaid Expansions,” Center for Studying Health Systems Change, Research Brief No. 19, March 2011; (2) Holahan, John and Headon, Irene, “Medicaid Coverage and Spending in Health Reform,” Kaiser Commission on Medicaid and the Uninsured, May 2010. PA is among ten states with 15 or more PCPs per 10,000 residents. (1) There are 2.2M Medicaid beneficiaries in PA. After 2014, this number could increase by 482,000 – a 22% increase. Of this number, 282,000 would be from among the uninsured with incomes at/below 133% of the FPL. (2) So, although PA seems to have adequate PCP capacity relative to the rest of the nation, the new demand might prove disruptive and difficult to satisfy.
Does “it” really matter? In 2008, only 10 percent of Medicaid beneficiaries did not have a usual source of care, compared with more than half of the uninsured(2008 analysis by the Kaiser Commission on Medicaid and the Uninsured). Oregon experience: in 2008, a group of uninsured low-income adults in Oregon was selected by lottery to be given the chance to apply for Medicaid, allowing for a randomized controlled study design on the effects of coverage. Findings: in the first year , the treatment group had substantively and statistically significantly higher health care utilization (35%), lower out-of-pocket medical expenditures (35%) and medical debt (25%), and better self-reported physical and mental health than the control group. Source: Finkelstein, Amy, et. al., “The Oregon Health Insurance Experiment: Evidence from the First Year,” National Bureau of Economic Research, NBER Working Paper No. 17190, July 2011.