
Seasonal Variations in Step Activity Among Individuals with Transfemoral Amputation
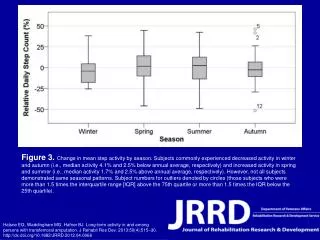
This study investigates the seasonal patterns of physical activity in individuals with transfemoral amputation. The findings indicate a notable decrease in activity levels during winter and autumn, with median activity 4.1% and 2.5% below the annual average, respectively. Conversely, subjects exhibited increased activity during spring and summer, with median levels rising 1.7% and 2.5% above the annual average. Additionally, not all subjects followed these seasonal patterns, highlighting significant variability. Outliers were identified as those demonstrating significant deviations from the interquartile range.

Seasonal Variations in Step Activity Among Individuals with Transfemoral Amputation
E N D
Presentation Transcript
Figure 3. Change in mean step activity by season. Subjects commonly experienced decreased activity in winter and autumn (i.e., median activity 4.1% and 2.5% below annual average, respectively) and increased activity in spring and summer (i.e., median activity 1.7% and 2.5% above annual average, respectively). However, not all subjects demonstrated same seasonal patterns. Subject numbers for outliers denoted by circles (those subjects who were more than 1.5 times the interquartile range [IQR] above the 75th quartile or more than 1.5 times the IQR below the 25th quartile). Halsne EG, Waddingham MG, Hafner BJ. Long-term activity in and among persons with transfemoral amputation. J Rehabil Res Dev. 2013;50(4):515–30.http://dx.doi.org/10.1682/JRRD.2012.04.0066