Download
1 / 1
10 likes | 134 Vues
A Diachronic Topological Analysis of the 13th May 2005 Solar Flare. William M.R. Simpson, Angela Des Jardins. University of St. Andrews, Montana State University. Abstract

E N D
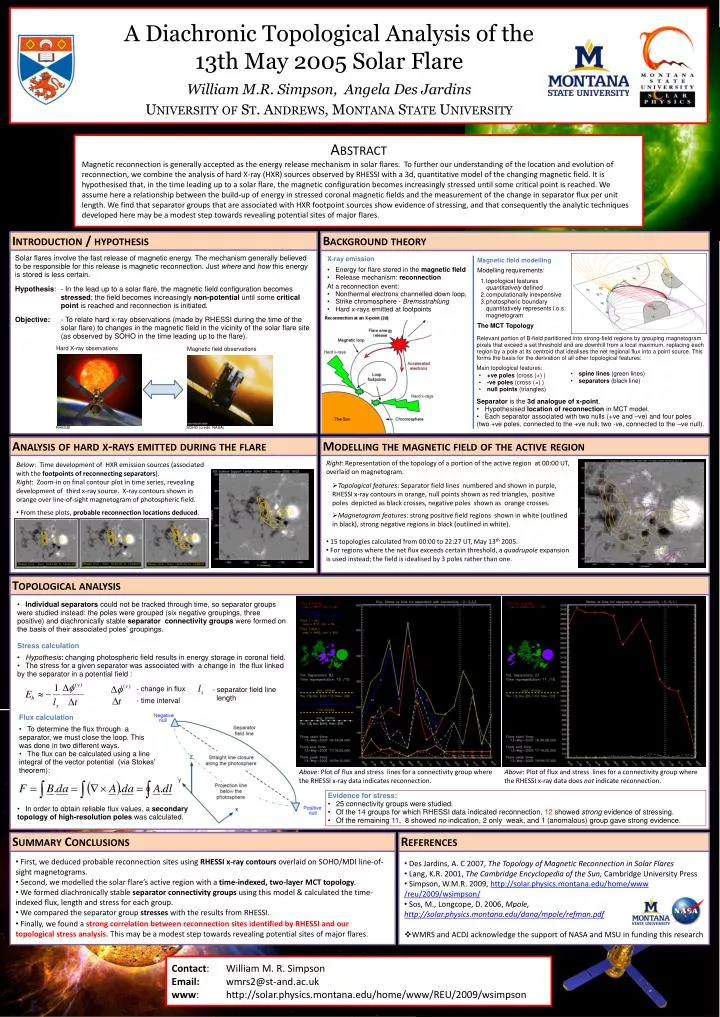
A Diachronic Topological Analysis of the 13th May 2005 Solar Flare William M.R. Simpson, Angela Des Jardins University of St. Andrews, Montana State University Abstract Magnetic reconnection is generally accepted as the energy release mechanism in solar flares. To further our understanding of the location and evolution of reconnection, we combine the analysis of hard X-ray (HXR) sources observed by RHESSI with a 3d, quantitative model of the changing magnetic field. It is hypothesised that, in the time leading up to a solar flare, the magnetic configuration becomes increasingly stressed until some critical point is reached. We assume here a relationship between the build-up of energy in stressed coronal magnetic fields and the measurement of the change in separator flux per unit length. We find that separator groups that are associated with HXR footpoint sources show evidence of stressing, and that consequently the analytic techniques developed here may be a modest step towards revealing potential sites of major flares. Introduction / hypothesis Background theory Solar flares involve the fast release of magnetic energy. The mechanism generally believed to be responsible for this release is magnetic reconnection. Just where and how this energy is stored is less certain. • X-ray emission • Energy for flare stored in the magnetic field • Release mechanism: reconnection • Magnetic field modelling • Modelling requirements: • topological features quantitatively defined • computationally inexpensive • photospheric boundary quantitatively represents l.o.s. magnetogram • The MCT Topology • At a reconnection event: • Nonthermal electrons channelled down loop, • Strike chromosphere - Bremsstrahlung • Hard x-rays emitted at footpoints Hypothesis: • In the lead up to a solar flare, the magnetic field configuration becomes stressed; the field becomes increasingly non-potential until some critical point is reached and reconnection is initiated. - To relate hard x-ray observations (made by RHESSI during the time of the solar flare) to changes in the magnetic field in the vicinity of the solar flare site (as observed by SOHO in the time leading up to the flare). Objective: • Relevant portion of B-field partitioned into strong-field regions by grouping magnetogram pixels that exceed a set threshold and are downhill from a local maximum, replacing each region by a pole at its centroid that idealises the net regional flux into a point source. This forms the basis for the derivation of all other topological features: • Main topological features: • Separator is the 3d analogue of x-point. • Hypothesised location of reconnection in MCT model. • Each separator associated with two nulls (+ve and –ve) and four poles (two +ve poles, connected to the +ve null; two -ve, connected to the –ve null). Hard X-ray observations Magnetic field observations • spine lines (green lines) • separators(black line) • +ve poles (cross (+) ) • -ve poles (cross (×) ) • null points (triangles) SOHO (credit: NASA) RHESSI Analysis of hard x-rays emitted during the flare Modelling the magnetic field of the active region • Right: Representation of the topology of a portion of the active region at 00:00 UT, overlaid on magnetogram. • Topological features: Separator field lines numbered and shown in purple, RHESSI x-ray contours in orange, null points shown as red triangles, positive poles depicted as black crosses, negative poles shown as orange crosses. • Magnetogram features: strong positive field regions shown in white (outlined in black), strong negative regions in black (outlined in white). • 15 topologies calculated from 00:00 to 22:27 UT, May 13th 2005. • For regions where the net flux exceeds certain threshold, a quadrupole expansion is used instead; the field is idealised by 3 poles rather than one. • Below: Time development of HXR emission sources (associated with the footpoints of reconnecting separators). • Right: Zoom-in on final contour plot in time series, revealing development of third x-ray source. X-ray contours shown in orange over line-of-sight magnetogram of photospheric field. • From these plots, probable reconnection locations deduced. Topological analysis • Individual separators could not be tracked through time, so separator groups were studied instead: the poles were grouped (six negative groupings, three positive) and diachronically stable separator connectivity groups were formed on the basis of their associated poles’ groupings. • Stress calculation • Hypothesis: changing photospheric field results in energy storage in coronal field. • The stress for a given separator was associated with a change in the flux linked by the separator in a potential field : - change in flux • separator field line • length - time interval • Flux calculation • To determine the flux through a separator, we must close the loop. This was done in two different ways. • The flux can be calculated using a line integral of the vector potential (via Stokes’ theorem): Above: Plot of flux and stress lines for a connectivity group where the RHESSI x-ray data indicates reconnection. Above: Plot of flux and stress lines for a connectivity group where the RHESSI x-ray data does not indicate reconnection. • Evidence for stress: • 25 connectivity groups were studied. • Of the 14 groups for which RHESSI data indicated reconnection, 12 showed strong evidence of stressing. • Of the remaining 11, 8 showed no indication, 2 only weak, and 1 (anomalous) group gave strong evidence. • In order to obtain reliable flux values, a secondary topology of high-resolution poles was calculated. Summary Conclusions References • First, we deduced probable reconnection sites using RHESSI x-ray contours overlaid on SOHO/MDI line-of-sight magnetograms. • Second, we modelled the solar flare’s active region with a time-indexed, two-layer MCT topology. • We formed diachronically stable separatorconnectivity groups using this model & calculated the time-indexed flux, length and stress for each group. • We compared the separator group stresses with the results from RHESSI. • Des Jardins, A. C 2007, The Topology of Magnetic Reconnection in Solar Flares • Lang, K.R. 2001, The Cambridge Encyclopedia of the Sun, Cambridge University Press • Simpson, W.M.R. 2009, http://solar.physics.montana.edu/home/www /reu/2009/wsimpson/ • Sos, M., Longcope, D. 2006, Mpole, http://solar.physics.montana.edu/dana/mpole/refman.pdf • WMRS and ACDJ acknowledge the support of NASA and MSU in funding this research • Finally, we found a strong correlation between reconnection sites identified by RHESSI and our topological stress analysis. This may be a modest step towards revealing potential sites of major flares. Contact: Email: www: William M. R. Simpson wmrs2@st-and.ac.uk http://solar.physics.montana.edu/home/www/REU/2009/wsimpson