Binomial Probability Distributions
This detailed overview covers binomial probability distributions, focusing on the calculations of mean and standard deviation for the number of successes. The formulas ( mu = np ) and ( sigma = sqrt{npq} ) are illustrated through practical examples, including literacy rates in the U.S. and success rates of surgeries. We explore the implications of these statistics through histogram representations and calculations involving probability. This guide provides essential insights for understanding and applying binomial distributions in real-world scenarios.

Binomial Probability Distributions
E N D
Presentation Transcript
Mean and Standard Deviation for number of successes µ=np and = (npq)1/2 where n = number of trials p = probability of success q = 1 - p = probability of failure
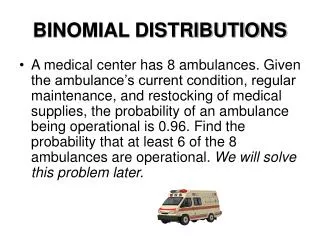
Example (5.3 # 7). USA Today reported that about 20% of all people in the United States are illiterate. Suppose 7 people in the U.S. are chosen at random. • Make a histogram showing the probability distribution for the number of illiterate people out of seven in the sample. • Find the mean and standard deviation of this probability distribution. • How many people would you need to interview to be 98% sure that at least seven of these people are literate?
(b) The mean and standard deviation for the number of illiterate people out of 7 are: = (7)(.2) = 1.4 = [(7)(.2)(.8)]1/2 = [1.12]1/2 = 1.0583
(c) Find the smallest value of n so that P(r ≥7) = .98 or more using p = .8 and q = .2. Using the table, we find that n=12 is the smallest such value.
Find the mean and standard deviation for the number of successes in a binomial distribution with: • n=20, p=.5 • n=20, p= .95 What might you generally expect to see in the histograms? Which will be more spread out? Where do you expect the highest bars?
For (a) = (20)(.5) = 10 = [(20)(.5)(.5)]1/2 = [5]1/2 = 2.236 For (b) = (20)(.95) = 19 = [(20)(.95)(.05)]1/2 = [.95]1/2 = .974
One would expect the histogram for (a) to be more spread out because of the larger standard deviation, and the highest bars should be near the mean in both distributions. The actual histograms are on the next slide.
Example: A surgeon has a 97% success rate on a certain type of laser eye surgery. Use the binomial distribution to find: (a) The probability that 18 of the next 20 surgeries the surgeon performs will be successful. (b) The probability that 19 of the next 20 surgeries the surgeon performs will be successful. (c) The probability that 20 of the next 20 surgeries the surgeon performs will be successful. (d) The probability that 17 or fewer of the next 20 surgeries the surgeon performs will be successful. (e) The mean and standard deviation for the number of successful surgeries out of 20.
Answers: (a) C20,18 (.97)18(.03)2 = .0988 (b) .3364 (c) .5438 (d) .0210 (e) mean: 19.4 standard deviation: .7629