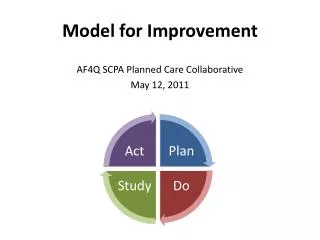
Model for Improvement
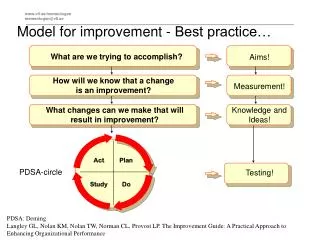
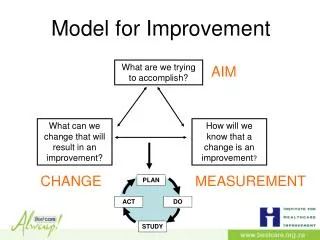
PLAN. DO. ACT. STUDY. Model for Improvement. What are we trying to accomplish?. AIM. What can we change that will result in an improvement?. How will we know that a change is an improvement ?. CHANGE. MEASUREMENT. PDSA –testing a change. MARU. From YouTube.

Model for Improvement
E N D
Presentation Transcript
PLAN DO ACT STUDY Model for Improvement What are we trying to accomplish? AIM What can we change that will result in an improvement? How will we know that a change is an improvement? CHANGE MEASUREMENT
PDSA –testing a change MARU From YouTube What is Maru trying to achieve? How many ideas does he try? Is he successful? What was the possible negative outcome?
Rapid Cycle Change PLAN PLAN PLAN PLAN DO DO DO DO ACT ACT ACT ACT STUDY STUDY STUDY STUDY What are we trying to accomplish? What can we change that will result in an improvement? How will we know that a change is an improvement?
PROBLEM : AIM of this change:
Do a PDSA to solve a problem at home AIM of this change:
PROBLEM : unpacking the dishwasher is inefficient AIM: unpack the dishwasher in a more efficient way • Tom to rearrange cupboard today • -Mary and Tom to unpack into one cupboard for 4 days How easy it is to unpack the dishwasher Put half the cups and half the glasses in the cupboard just above the dishwasher Mary – it will look horrible and I will hate it Tom – it will be easy and Mary will like it
PLAN DO ACT STUDY Model for Improvement What are we trying to accomplish? AIM What can we change that will result in an improvement? How will we know that a change is an improvement? CHANGE MEASUREMENT
Measurement Outcome measure Are we getting closer to our target?
Measurement Process measure (Bundle compliance) Did we use the whole bundle in every patient every time?
Measurement Measuring the impact of a change Was the change an improvement?
Measuring over time • a volunteer to write • a volunteer to measure • graph paper
Annotated Run Chart Community Need Change Made in June I
Interpreting Data: what is the story? Before (Feb) After (Aug) I
What is the real story? Feb Aug Feb Aug Change Made Change Made Feb Aug Change Made in June Feb Aug Feb Aug Change Made Change Made I
Prevention of Mother to Child Transmission. A sub-district in a province in SA Positive PCRs at 6 weeks (target <5%) Feb 2010 8.2% Feb 2011 3.2% Improvement?
Positive PCRs at 6 weeks (target <5%) Feb 2010 8.2% Feb 2011 3.2% Improvement?
Run Chart: Rules for Identifying Statistically Significant Change Median Median Shift: 6 points in row on same side of the median Note: A point exactly on the centerline does not cancel or count towards a shift Rule 2 Rule 1 Trend:5points in row headed in same direction Note: Ties between two consecutive points don’t cancel or add to a trend Rule 3 Rule 4 Data line crosses once Too few runs: total 2 runs Median Median 11.4 Astronomical Point: a obviously, even blatantly different value Note: Every set of data will have a highest and lowest data point. This does not mean the high or low are astronomical Runs: too few or too many runs I Provost and Murray
Run Charts One of the most powerful tools for improvement Describe a process over time Shows trends the process is experiencing Can be used to analyse whether the change was an improvement Data can be used to drive change
Outcome measurement Are we getting to our target? Was the change an improvement? How do we measure HAIs?
Measuring infection rates Lessons from an ICU
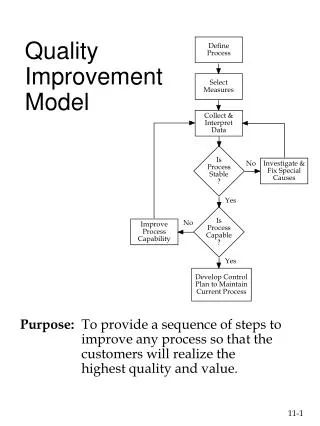
Quality Improvement 101 Problem?
Measuring Infection Rates • Total number of infective cases per 1,000 device days: Total No. of VAP cases X 1,000 Numerator Ventilator days Denominator
Definition of VAP “Pneumonia is considered as ventilator associated if the patient was intubated and ventilated at the time orwithin 48hrs before the onset of the infection” “VAP is suspected when a patient on mechanical ventilation develops: a new or progressive pulmonary infiltratewith fever /leucocytosis and purulent tracheobronchial secretions”
Overcoming Numerator Issues Numerator Total No. of VAP cases Patients with X 1,000 Ventilator days Denominator
Overcoming Numerator Issues – diagnosing the HAI (workbook) Checklists for Diagnosing the HA Infection used by the team
Overcoming Denominator Issues At the same time every day the Unit manager counts devices in use in the ward