Download

1 / 50
650 likes | 1.43k Vues
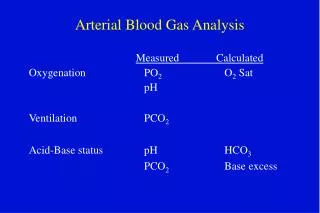
ARTERIAL BLOOD GAS. Section of Pediatric Pulmonology UPCM-Philippine General Hospital. Clinical Application of Blood Gases 5 th Edition. Shapiro, et. Al. ABG measures respiratory function. 1. Oxygenation status. 2. Acid-base balance. Points to Remember.

E N D
ARTERIAL BLOOD GAS Section of Pediatric Pulmonology UPCM-Philippine General Hospital
Clinical Application of Blood Gases 5th Edition Shapiro, et. Al.
ABG measures respiratoryfunction 1. Oxygenation status 2. Acid-base balance
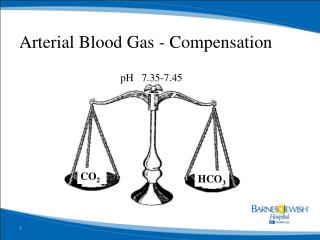
Points to Remember • Body always tries to maintain normal pH • CO2 – respiratory • HCO3 – metabolic • Lungs compensate rapidly • Kidneys compensate slowly • There is no overcompensation except • in chronic ventilatory failure • Consider the underlying disease
Normal ABG Values • pH 7.35-7.45 • 7.3-7.5 clinically acceptable • PO280-100 • 60-80 for newborn, preterm • < 1 mm Hg for every year > age 60 • PCO2 35-45 • 30-50 clinically acceptable
Oxygenation Status At room air, sea level: PaO2 80-100 normal or acceptable PaO2 < 80 mild hypoxemia PaO2 < 60 moderate hypoxemia PaO2 < 40 severe hypoxemia On oxygen support: PaO2 80-100 corrected hypoxemia PaO2 > N overcorrected hypoxemia PaO2 < N uncorrected hypoxemia
Nomenclature for pH & PaCO2 Outside of normal range pH > 7.45 Alkalemia pH < 7.35 Acidemia PaCO2 > 45 mmHg Respiratory Acidosis (hypercapnia) PaCO2 < 35 mmHg Respiratory Alkalosis (hypocapnia)
FiO2 vs PaO2 The minimally acceptable PaO2 increases by approximately 50 mmHg for every 10% increment of inspired oxygen concentration.
PAO2 = [ FiO2 (PB – PH20) ] – PaCO2 0.8 FiO2 vs PaO2 PaO2 = FiO2 x 5
PAO2 = [ FiO2 (PB – PH20) ] – PaCO2 0.8 What is the expected PAO2if you are breathing normally at room air? = [ .21(760 – 47) ] – 40 / 0.8 = 150 – 50 = 100 PaO2 = FiO2 x 5 = .21 x 5 = 105
PAO2 vs PaO2 In normal individuals the PAO2 is more or less equal to the PaO2 with a normal shunt of about 5 %
P(A-a)O2 = PAO2 - PaO2 FiO2 vs PaO2 Normal: < 30 mm Hg at room air < 50 mm Hg at FiO2 1.0 > 450 mmHg is indicative of severe respiratory failure
PaCO2 – pH RELATIONSHIP • For every 10 mm Hg increase in the PaCO2, the • pH will decrease by 0.05 unit. • For every 10 mm Hg decrease in the PaCO2, the • pH will increase by 0.10 unit.
Respiratory pH (pHR) PaCO2 pHR 80 7.2 60 7.3 40 7.4 30 7.5 20 7.6
For every in pCO2 of 10 , pH by 0.05 Respiratory pH (pHR) PaCO2 pHR 80 7.2 60 7.3 40 7.4
Computing for pHR • Normal pCO2 = 40 and normal pH = 7.4 If actual pCO2 > 40: pHR = (40 – Actual pCO2) x 0.05 + 7.4 10
PaCO2 pHR For every in pCO2 of 10 , pH by 0.1 40 7.4 30 7.5 20 7.6 Respiratory pH (pHR)
pHR = (40 – Actual pCO2) x 0.1 + 7.4 10 Computing for pHR • Normal pCO2 = 40 and normal pH = 7.4 If actual pCO2 > 40: pHR = (40 – Actual pCO2) x 0.05 + 7.4 10 If actual pCO2 < 40:
If actual pCO2 > 40: pHR = (40 – Actual pCO2) x 0.05 + 7.4 10 pHR = (40 – 45) x 0.05 + 7.4 10 What is the expected pH when the pCO2 is 45? = 7.375
If actual pCO2 < 40: pHR = (40 – Actual pCO2) x 0.1 + 7.4 10 pHR = (40 – 35) x 0.1 + 7.4 10 What is the expected pH when the pCO2 is 35? = 7.45
pHR vs pH If pHR compared to actual pH is: < 0.03 purely respiratory > 0.03 compensated
pHR vs pH If actual pH > pHR partially compensated If actual pH < pHR mixed If actual pH = pHR purely respiratory
PaCO2 – Plasma BICARBONATE RELATIONSHIP • An acute PaCO2 increase of 10 mmHg will • increase the plasma bicarbonate by 1 mmol/L • An acute PaCO2 decrease of 10 mmHg will • decrease the plasma bicarbonate by 2 mmol/L The difference between the calculated respiratory plasma bicarbonate value and the actual plasma bicarbonate value provides a rapid and easy assessment of the metabolic component.
Approximate PaCO2-pH Relationship PaCO2 pH HCO3 (mmHg) (mmol/L) 80 7.20 28 60 7.30 26 40 7.40 24 30 7.50 22 20 7.60 20
Minute Ventilation vs PaCO2 MV PaCO2 Range N 40 35-45 2N 30 25-35 4N 20 15-25 The existence of a significant minute MV to PaCO2 disparity should alert the clinician to the possibility that a deadspace-producing pathologic condition may be present.
FiO2-PaO2 RELATIONSHIP Inspired Oxygen to PaO2 Relationship in Normal lungs. FiO2 Inspired O2(%) PaO2 0.30 30 >150 0.40 40 >200 0.50 50 >250 0.80 80 >400 1.00 100 >500
DETERMINING BASE EXCESS/DEFICIT Under normal circumstances, a 10 mmol/L variance from the normal buffer base represents a pH change of approximately 0.15 unit. If we move the pH decimal point two places to the right, we have a 10 to 15 relationship, which can be expressed as a 2/3 realtionship.
BE or BD = (actual pH – pHR) x 2 3 The difference between the measured pH & the predicted respiratory pH is the metabolic pH change. x 100
BE or BD = (actual pH – pHR) x 200 3 Base excess or deficit 0.15 pH change 10 mEq/L buffer change BE: actual pH > pHR BD: actual pH < pHR Normal BE or BD: 2
INTERPRETIVE APPROACH Step 1. Assessment of the PCO2 and pH. a. Classify the CO2 tension. b. Consider the pH and determine classification. c. Consider the base excess/deficit or bicarbonate levels and determine classification. Step 2. Assessment of Arterial Oxygenation a. PaO2 b. SaO2
acidosis acidosis alkalosis alkalosis acidosis alkalosis acidosis acidosis alkalosis alkalosis pH < 7.35 pH 7.35 – 7.4 pH 7.4 – 7.45 pH > 7.45 pCO2 < 35 pCO2 35-45 normal normal pCO2 > 45
part comp comp comp metabolic metabolic respiratory respiratory acidosis acidosis alkalosis alkalosis metabolic metabolic acidosis alkalosis comp comp part comp respiratory respiratory metabolic metabolic acidosis acidosis alkalosis alkalosis pH < 7.35 pH 7.35 – 7.4 pH 7.4 – 7.45 pH > 7.45 pCO2 < 35 pCO2 35-45 normal normal pCO2 > 45
Physiologic Mechanisms of Hypoxemia • Alveolar hypoventilation • Ventilation-perfusion mismatch • Right-to-left shunt • Diffusion limitation • Decreased ambient oxygen tension
CO2 variable N- CVS N Clinical response A- neuro- muscular P A- CVS P Response to O2 good good poor good CXR N- central W- alveolar W- lung N- CVS minimal W Physiologic Mechanisms of Hypoxemia Alveolar hypo-ventilation V/Q mismatch R to L shunt Diffusion limitation W –white N - normal P - poor A - absent
Metabolic acidosis • Renal failure (RTA) • Ketoacidosis (DKA, starvation) • Lactic acidosis
Anion Gap = Na – (Cl + HCO3) Normal: < 15 mEq/L
Anion Gap Increased Normal Loss of buffer Renal HCO3 loss Renal tubular acidosis Acetazolamide Renal dysplasia GI HCO3 loss Diarrhea Cholestyramine Small bowel drainage Dilutional acidosis Hyperalimentation acidosis • Organic acid accumulation • Acute renal failure • Inborn error of metabolism • Lactic acidosis • Late metabolic acidosis • Toxins
Metabolic alkalosis • Hypokalemia • Hypochloremia • Vomiting • Massive steroid administration • NaHCO3 administration
Respiratory acidosis • 1. Hypoventilation • Inadequate respiratory effort • CNS problems • Neuromuscular disease • Mechanical ventilator settings • Upper airway not patent • Decreased lung tissue • Decreased lung compliance
Respiratory acidosis • 2. Abnormal ventilation-perfusion ratio • a. Obstruction of small airways • b. Atelectasis • c. Pneumonia • d. Pulmonary edema • 3. Increased extrapulmonary shunt • Pulmonary vasoconstriction • RDS, severe infection • Pulmonary hypoplasia • Cyanotic heart disease
Respiratory alkalosis • With hypoxemia • a. Acute pulmonary disease • pneumonia and atelectasis, RDS, acute asthma • Acute myocardial disease • MI, pulmonary edema, heart failure, CP bypass • 2. Without hypoxemia • Anxiety, neurosis, psychosis • Pain • CNS disease • Anemia • Carbon monoxide poisoning
Disorders Expected compensation Metabolic pCO2 = 1.5 x HCO3 + 8 +/- 2 Acidosis Metabolic pCO2 increase by 7 mmHg for each Alkalosis 10 mEq/L increase in HCO3
Disorder Expected compensation • Respiratory acidosis • Acute HCO3 increase by 1 for each 10mmHg increase in pCO2 Chronic HCO3 increase by 3.5 for each 10mmHg increase in pCO2 Respiratory Alkalosis Acute HCO3 decrease by 2 for each 10mmHg decrease in pCO2 Chronic HCO3 decrease by 4 for each 10mmHg decrease in pCO2
Exercises Compute for the pHR and interpret the ABG values
pHR = (40 - 32) x 0.1 + 7.4 = 7.48 BE/BD = (7.45 – 7.48) x 200 = -2 10 3 respiratory alkalosis 1. pH 7.45 pO2 65 pCO2 32 FiO2 .21 HCO3 compensated with mild hypoxemia
pHR = (40 - 30) x 0.1 + 7.4 = 7.5 BE/BD = (7.3 – 7.5) x 200 = -13 10 3 metabolic acidosis 2. pH 7.3 pO2 120 pCO2 30 FiO2 .30 HCO3 partially compensated with overcorrected hypoxemia
pHR = (40 - 55) x 0.05 + 7.4 = 7.325 BE/BD = (7.25 – 7.325) x 200 = - 5 10 3 acidosis 3. pH 7.25 pO2 90 pCO2 55 FiO2 .40 N HCO3 uncompensated respiratory with corrected hypoxemia
N N pHR = (40 - 35) x 0.1 + 7.4 = 7.45 BE/BD = (7.42 – 7.45) x 200 = -2 10 3 normal acid-base balance 4. pH 7.42 pO2 200 pCO2 35 FiO2 .35 HCO3 N with overcorrected hypoxemia
Calculating FiO2 requirement using the ABG FiO2 = (desired PaO2) + PaCO2 PaO2 RQ PAO2 Pb – PH20