Multimodal LOS For Urban Streets
230 likes | 606 Vues
Multimodal LOS For Urban Streets. Richard Dowling – Dowling Associates. Multimodal LOS Philosophy. Multimodal Level of Service (MMLOS) Analysis for Urban Streets Each urban street right-of-way is shared by 4 major types of users: Automobile Drivers Transit Passengers Bicyclists

Multimodal LOS For Urban Streets
E N D
Presentation Transcript
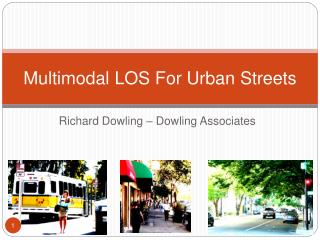
Multimodal LOS For Urban Streets Richard Dowling – Dowling Associates
Multimodal LOS Philosophy • Multimodal Level of Service (MMLOS) Analysis for Urban Streets • Each urban street right-of-way is shared by 4 major types of users: • Automobile Drivers • Transit Passengers • Bicyclists • Pedestrians • The urban street should serve all users
Definition of MMLOS • MMLOS is the degree to which the urban street design and operations meets the traveling needs of each user type. • Four level of service grades for each street: • Auto LOS, Transit LOS, Bicycle LOS, Pedestrian LOS • MMLOS is a report card, not a single grade. Bancroft Avenue Level of Service User TypeAM Pk HrPM Pk Hr Auto C E Transit B C Bicycle D C Pedestrian C D
NCHRP 3-70 Research Project • Objective: To develop a scientific basis for evaluating multimodal LOS on urban streets • 4-year, $1.1 million project • U.S. modal experts • Dr. Aimee Flannery, George Mason University • Dr. Nagui Rouphail, North Carolina State University • Bruce Landis, Sprinkle Consulting • Theo Petritsch, Sprinkle Consulting • Paul Ryus, Kittelson Associates
Data Collection • Selected and shot video clips of 90 typical street cross sections from point of view of auto driver, bicycle rider, and pedestrian. • Showed the clips to 120 people in video labs in four cities. • College Station, Texas • New Haven, Connecticut • San Francisco, California • Chicago, Illinois • Asked to rate each clip’s trip experience from “best” to “worst.”
What about Transit? • Did on-board surveys in Miami, Baltimore, Portland, and San Francisco • No matter how bad the service, everybody on board the bus liked it. • Used mode choice survey results and known patronage elasticities to construct transit LOS model
Factors Affecting Auto LOS • Average Travel Speed for Through Traffic • Number of Stops per Mile • These two factors are in turn influenced by: • Demand, capacity, posted speed limit, number of lanes, signal timing, coordination, interference from other users (bus, bike, pedestrian) • 4 Models to Test
Factors Affecting Transit LOS • Frequency of Service • Speed of Service • Passenger Load • Reliability • Accessibility • Bus StopAmenities
Factors Influencing Bicycle LOS • Segment Experience • Intersection Experience • Driveway Interference
Bicyclist Segment LOS • Vehicle Traffic Volume in Outside (Right) Lane • Percent Trucks • Vehicle Speeds • Lateral Separation From Vehicles • Average effective paved width • Outside lane, bike lane, shoulder lane (if no parking) • Discounted for on-street parking • Pavement Quality (1-5)
Bicycle Intersection LOS • Vehicle Traffic Volume in Outside (Right) Lane • Percent Trucks • Vehicle Speeds • Lateral Separation From Vehicles • Width of outside lane plus bike lane • Signalized Intersection Cross-Street Width
Bicycle Driveway Conflicts • Density of unsignalized intersections and driveways per mile • Right-hand side of street.
Factors Influencing Pedestrian LOS • Segment Experience • Travel along segment • Mid-block crossing • Intersection Experience • Pedestrian Density
Pedestrian Segment LOS • Function of: • Vehicle volume in rightmost lane • Vehicle speeds • Lateral separation between vehicles and pedestrians • Barriers (trees, bushes, barricades) • On-Street parking • Presence and width of sidewalk
Pedestrian Intersection LOS • Function of: • Vehicle volumes and speeds • Right turns on red and left turns during “Walk” phase • Right turn channelization islands (pork chops) • Cross-street vehicle traffic and speeds • Lanes on the cross-street • Delay waiting to cross at signal
Ped. Midblock Crossing Difficulty • Can increase or decrease pedestrian LOS by up to 20%. • Factor is related to the minimum of: • Delay waiting for gap in traffic • Delay walking to nearest signalized intersection • Midblock crossing computation can be turned off.
Software Implementation • Now: • Free, unsupported, research quality spreadsheet • Comments welcome • After June 2010 • If/When included in HCM 2010 update • May be included in some commercial quality, supported software (HCS)
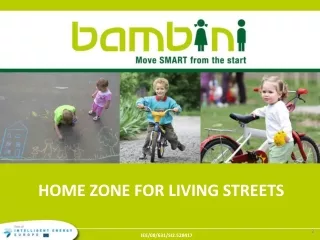
Sharing The Street Before After
To Learn More • Final Report: NCHRP Report #616 • http://onlinepubs.trb.org/onlinepubs/nchrp/nchrp_rpt_616.pdf • User’s Guide: NCHRP Web document 128 • http://onlinepubs.trb.org/onlinepubs/nchrp/nchrp_w128.pdf • For more information contact: • Rick Dowling, Dowling Associates, Oakland, CA • Phone: 510-839-1742 x 120, rdowling@dowlinginc.com