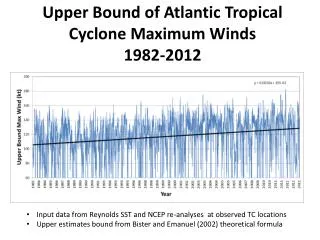
Download
1 / 43
430 likes | 538 Vues
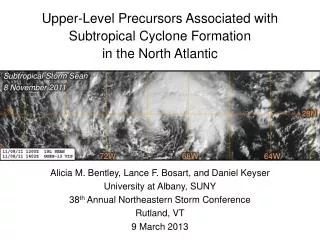
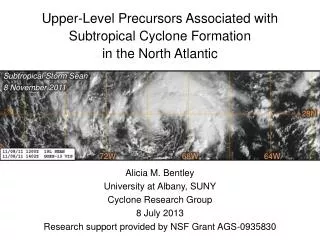
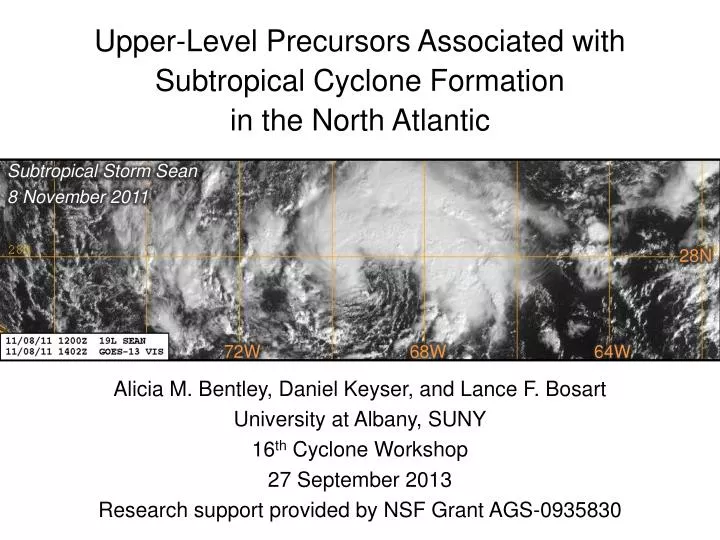
Upper-Level Precursors Associated with Subtropical Cyclone Formation in the North Atlantic. Subtropical Storm Sean 8 November 2011. 28N. 72W. 68W. 6 4 W. Alicia M. Bentley, Daniel Keyser, and Lance F. Bosart University at Albany, SUNY 16 th Cyclone Workshop 27 September 2013

E N D
Upper-Level Precursors Associated with Subtropical Cyclone Formation in the North Atlantic Subtropical Storm Sean 8 November 2011 28N 72W 68W 64W Alicia M. Bentley, Daniel Keyser, and Lance F. Bosart University at Albany, SUNY 16th Cyclone Workshop 27 September 2013 Research support provided by NSF Grant AGS-0935830
Subtropical Cyclones Operational Definition • “A non-frontal low-pressure system that has characteristics of both tropical and extratropical cyclones.” • “Unlike tropical cyclones, subtropical cyclones derive a significant portion of their energy from baroclinic sources…often being associated with an upper-level low or trough.” − National Hurricane Center Online Glossary (2012)
Subtropical Cyclones DiabaticEnergySources TCs Subtropical cyclones Frontal cyclones BaroclinicEnergy Sources Adapted from Fig. 9 in Beven (2012)30th Conference on Hurricanes and Tropical Meteorology
Motivation • There is currently no objective set of characteristics used to define subtropical cyclones (STCs) • The hybrid nature of STCs makes them likely candidates to become tropical cyclones (TCs) via the tropical transition (TT) process • Few studies address the relationship between STCs, TC development, and high-impact weather events
Outline • Adapt Davis (2010) methodology for STC identification • Refine objective STC identification technique and apply to North Atlantic baroclinically influenced tropical cyclogenesis cases to construct STC climatology (1979–2010) • Perform a cyclone-relative composite analysis of the upper-tropospheric features linked to STC formation • Discussion and Conclusions
Adapt Davis (2010) Methodology • Davis (2010) methodology: • Based on Ertel potential vorticity (PV) • Formulated in terms of two PV metrics that quantify the relative contributions of baroclinicprocesses and condensation heating to the evolution of individual cyclones • Davis (2010) methodology is similar to Hart (2003) cyclone phase space diagrams
Adapt Davis (2010) Methodology • Lower-troposphericbaroclinic processes:(near-surface potentialtemperature anomaly) 425 hPa Potential temperature anomaly Length of 6° of latitude absolute vorticity
Adapt Davis (2010) Methodology • Lower-troposphericbaroclinic processes:(near-surface potentialtemperature anomaly) • Midtroposphericlatent heat release:(interior PVanomaly) 425 hPa Potential temperature anomaly Length of 6° of latitude absolute vorticity Ertel PV anomaly PV1/PV2 : measure of the contribution of lower-troposphericbaroclinic processes relative to the contribution of condensation heating
Adapt Davis (2010) Methodology 200 hPa 925 hPa
Adapt Davis (2010) Methodology • Lower-troposphericbaroclinic processes:(near-surface potentialtemperature anomaly) 200 hPa 925 hPa Lower-tropospheric baroclinic processes (PV1)
Adapt Davis (2010) Methodology • Lower-troposphericbaroclinic processes:(near-surface potentialtemperature anomaly) • Midtroposphericlatent heat release:(interior PV anomaly) 200 hPa 925 hPa Lower-tropospheric baroclinic processes (PV1)
Adapt Davis (2010) Methodology • Lower-troposphericbaroclinic processes:(near-surface potentialtemperature anomaly) • Midtroposphericlatent heat release:(interior PV anomaly) 200 hPa 500 hPa Midtroposphericlatent heat release (PV2) 925 hPa Lower-tropospheric baroclinic processes (PV1) PV1/PV2 : measure of the contribution of lower-tropospheric baroclinic processes relative to the contribution of condensation heating
Adapt Davis (2010) Methodology • Introduce additional metric to diagnose upper-tropospheric dynamical processes • Upper-troposphericdynamical processes:(upper-tropospheric PV anomaly) Ertel PV anomaly 300 hPa Length of 6° of latitude
Adapt Davis (2010) Methodology • Lower-troposphericbaroclinic processes:(near-surface potentialtemperature anomaly) • Midtroposphericlatent heat release:(interior PV anomaly) 200 hPa 500 hPa Midtroposphericlatent heat release (PV2) 925 hPa Lower-tropospheric baroclinic processes (PV1) PV1/PV2 : measure of the contribution of lower-troposphericbaroclinic processes relative to the contribution of condensation heating
Adapt Davis (2010) Methodology • Lower-troposphericbaroclinic processes:(near-surface potentialtemperature anomaly) • Midtroposphericlatent heat release:(interior PV anomaly) • Upper-troposphericdynamical processes:(upper-tropospheric PV anomaly) Upper-troposphericdynamical processes(PV3) 200 hPa 500 hPa Midtroposphericlatent heat release (PV2) 925 hPa Lower-tropospheric baroclinic processes (PV1) PV1/PV2 : measure of the contribution of lower-troposphericbaroclinic processes relative to the contribution of condensation heating
Adapt Davis (2010) Methodology • Lower-troposphericbaroclinic processes:(near-surface potentialtemperature anomaly) • Midtroposphericlatent heat release:(interior PV anomaly) • Upper-troposphericdynamical processes:(upper-tropospheric PV anomaly) Upper-troposphericdynamical processes(PV3) 200 hPa 500 hPa Midtroposphericlatent heat release (PV2) 925 hPa Lower-tropospheric baroclinic processes (PV1)
Adapt Davis (2010) Methodology • Lower-troposphericbaroclinic processes:(near-surface potentialtemperature anomaly) • Midtroposphericlatent heat release:(interior PV anomaly) • Upper-troposphericdynamical processes:(upper-tropospheric PV anomaly) Upper-troposphericdynamical processes(PV3) 200 hPa 500 hPa Midtroposphericlatent heat release (PV2) 925 hPa Lower-tropospheric baroclinic processes (PV1) PV3/PV2 : measure of the contribution of upper-troposphericdynamical processes relative to the contribution of condensation heating
STC Identification • Apply adapted Davis (2010) methodology to a subset of North Atlantic baroclinically influenced tropical cyclogenesis cases identified in McTaggart-Cowan et al. (2013) • IBTrACS (v03r03) • North Atlantic tropical cyclogenesis cases1948–2010: 816 cases1979–2010: 460 cases (period of CFSR) • 36 h backward trajectories obtained using a reverse steering flow calculation (McTaggart-Cowan et al. 2008) and added to IBTrACS
STC Identification N = 460 Strong TT Weak TT Trough induced Low-level baroclinicNonbaroclinic
STC Identification N = 460 Strong TT Weak TT Trough induced Low-level baroclinicNonbaroclinic Category Description Strong TT Upper-level disturbance without strong lower-level thermal gradients Weak TT Upper-level disturbance with moderate lower-level thermal gradients Trough induced Upper-level disturbance without appreciable lower-level thermal gradients Low-level baroclinic Strong lower-level thermal gradients without an upper-level disturbance Nonbaroclinic No appreciable baroclinic influences
STC Identification N = 460 Strong TT Weak TT Trough induced Low-level baroclinicNonbaroclinic Category Description Strong TT Upper-level disturbance without strong lower-level thermal gradients Weak TT Upper-level disturbance with moderate lower-level thermal gradients Trough induced Upper-level disturbance without appreciable lower-level thermal gradients Low-level baroclinic Strong lower-level thermal gradients without an upper-level disturbance Nonbaroclinic No appreciable baroclinic influences
STC Identification N = 460 Strong TT Weak TT Trough induced Low-level baroclinicNonbaroclinic Category Description Strong TT Upper-level disturbance without strong lower-level thermal gradients Weak TT Upper-level disturbance with moderate lower-level thermal gradients Trough induced Upper-level disturbance without appreciable lower-level thermal gradients Low-level baroclinic Strong lower-level thermal gradients without an upper-level disturbance Nonbaroclinic No appreciable baroclinic influences
STC Identification N = 460 Strong TT Weak TT Trough induced Low-level baroclinicNonbaroclinic
STC Identification N = 222 Strong TT Weak TT Trough induced Low-level baroclinicNonbaroclinic
STC Identification • Identify STC signature in PV metrics to refine objective identification technique • Determine the time and position when individual cyclones became STCs using objective identification technique to construct STC climatology (1979–2010) • Perform a cyclone-relative composite analysis to document the structure, motion, and evolution of the upper-tropospheric features linked to STC formation
STC Identification • Identify STC signature in PV metrics to refine objective identification technique • Determine the time and position when individual cyclones became STCs using objective identification technique to construct STC climatology (1979–2010) • Perform a cyclone-relative composite analysis to document the structure, motion, and evolution of the upper-tropospheric features linked to STC formation
STC Identification STC Sean (2011) 1745 UTC 7 November 2011 PV3/PV2 PVU EX LOSTC TS EX Image courtesy of NASA Goddard MODIS Rapid Response Team 9 Nov 7 Nov 8 Nov 10 Nov 12 Nov 11 Nov PV1 PV2 PV3 PV3/PV2
STC Identification STC Sean (2011) 1745 UTC 7 November 2011 PV3/PV2 PVU EX LOSTC TS EX Image courtesy of NASA Goddard MODIS Rapid Response Team 9 Nov 7 Nov 8 Nov 10 Nov 12 Nov 11 Nov PV1 PV2 PV3 PV3/PV2
STC Identification STC Sean (2011) Criteria: PV3/PV2 PVU EX LOSTC TS EX 9 Nov 7 Nov 8 Nov 10 Nov 12 Nov 11 Nov PV1 PV2 PV3 PV3/PV2
STC Identification STC Sean (2011) Criteria: • Slope of PV3/PV2 < 0 at t = 0 h, 6 h PV3/PV2 PVU EX LOSTC TS EX 9 Nov 7 Nov 8 Nov 10 Nov 12 Nov 11 Nov PV1 PV2 PV3 PV3/PV2
STC Identification STC Sean (2011) Criteria: • Slope of PV3/PV2 < 0 at t = 0 h, 6 h • PV3 > 0 and PV2 > 0 at t = 0 h PV3/PV2 PVU EX LOSTC TS EX 9 Nov 7 Nov 8 Nov 10 Nov 12 Nov 11 Nov PV1 PV2 PV3 PV3/PV2
STC Identification STC Sean (2011) Criteria: • Slope of PV3/PV2 < 0 at t = 0 h, 6 h • PV3 > 0 and PV2 > 0 at t = 0 h • Slope of PV3 < 0 at t = 6h, 12 h PV3/PV2 PVU EX LOSTC TS EX 9 Nov 7 Nov 8 Nov 10 Nov 12 Nov 11 Nov PV1 PV2 PV3 PV3/PV2
STC Identification STC Sean (2011) Criteria: • Slope of PV3/PV2 < 0 at t = 0 h, 6 h • PV3 > 0 and PV2 > 0 at t = 0 h • Slope of PV3 < 0 at t = 6h, 12 h • Not a hurricane • Not a tropical storm • Not a tropical depression for ≥ 12 h PV3/PV2 PVU EX LOSTC TS EX 9 Nov 7 Nov 8 Nov 10 Nov 12 Nov 11 Nov PV1 PV2 PV3 PV3/PV2
STC Identification STC Sean (2011) Criteria: • Slope of PV3/PV2 < 0 at t = 0 h, 6 h • PV3 > 0 and PV2 > 0 at t = 0 h • Slope of PV3 < 0 at t = 6h, 12 h • Not a hurricane • Not a tropical storm • Not a tropical depression for ≥ 12 h PV3/PV2 PVU EX LOSTC TS EX 9 Nov 7 Nov 8 Nov 10 Nov 12 Nov 11 Nov = STC identified PV1 PV2 PV3 PV3/PV2
STC Climatology (1979–2010) N = 105 ~3 STCs/year Strong TT Weak TT Trough Induced Average Strong TT Average Weak TT Average Trough Induced Average STC
STC Climatology (1979–2010) N = 105 ~3 STCs/year Strong TT Weak TT Trough Induced Average Strong TT Average Weak TT Average Trough Induced Average STC
STC Climatology (1979–2010) N = 34 ~3 STCs/year Strong TT Weak TT Trough Induced Average Strong TT Average Weak TT Average Trough Induced Average STC
STC Climatology (1979–2010) N = 56 ~3 STCs/year Strong TT Weak TT Trough Induced Average Strong TT Average Weak TT Average Trough Induced Average STC
STC Climatology (1979–2010) N = 15 ~3 STCs/year Strong TT Weak TT Trough Induced Average Strong TT Average Weak TT Average Trough Induced Average STC
STC Climatology (1979–2010) N = 125 ~3 STCs/year Strong TT Weak TT Trough Induced Average Strong TT Average Weak TT Average Trough Induced Average STC
STC Climatology (1979–2010) N = 105 ~3 STCs/year Strong TT Weak TT Trough Induced Average Strong TT Average Weak TT Average Trough Induced Average STC
Conclusions • STCs have characteristics of both tropical and extratropicalcyclones and are likely candidates to become TCs via TT • Davis (2010) methodology adapted to quantify the relative contributions of lower-tropospheric baroclinic processes, midtropospheric condensation heating, and upper-tropospheric dynamical processes during baroclinically influenced tropical cyclogenesis events • Upper-tropospheric PV reduced and lower-tropospheric PV enhanced during STC formation • Cyclone-relative composite analysis revealed that STCs form beneath intrusions of midlatitude PV streamers into the subtropics associated with AWB events
Questions? ambentley@albany.edu • STCs have characteristics of both tropical and extratropicalcyclones and are likely candidates to become TCs via TT • Davis (2010) methodology adapted to quantify the relative contributions of lower-tropospheric baroclinic processes, midtropospheric condensation heating, and upper-tropospheric dynamical processes during baroclinically influenced tropical cyclogenesis events • Upper-tropospheric PV reduced and lower-tropospheric PV enhanced during STC formation • Cyclone-relative composite analysis revealed that STCs form beneath intrusions of midlatitude PV streamers into the subtropics associated with AWB events Special Thanks: Chris Davis and Ron McTaggart-Cowan