Comprehensive Market Analysis of Downtown and SoBro, Nashville
This report presents a detailed market analysis of Nashville's Downtown and SoBro areas, highlighting key economic findings and development potential. It discusses existing conditions, including demographics and occupancy within various sectors such as housing, retail, and office space. The analysis also forecasts future growth in employment and real estate demand, outlining strategic planning concepts for sustainable development, market management, and financing strategies. This information aims to guide the Nashville Metropolitan Development and Housing Agency's initiatives and assist in informing the SoBro Master Plan.

Comprehensive Market Analysis of Downtown and SoBro, Nashville
E N D
Presentation Transcript
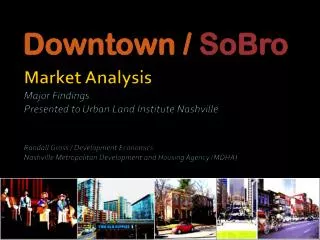
Downtown / SoBro Market AnalysisMajor Findings Presented to Urban Land Institute NashvilleRandall Gross / Development EconomicsNashville Metropolitan Development and Housing Agency (MDHA)
Introduction & Purpose • Market Analysis • Forecast potential: All uses in SoBro & broader Downtown Area • Downtown: the economic “core of the apple” & “face of Nashville” • Strategic Planning • Translate the market findings into development, marketing, management, and financing strategies for implementation • Purpose of this Information • MDHA: Programs, redevelopment policies & incentives • Specific attention to Rolling Mill Hill • Inform the SoBro Master Plan (CCA) • Downtown development planning & ED • Downtown marketing • Data/information to help guide private development
EXISTING CONDITIONS • Location • Center of 13-county MSA; market of 1.7 million • 1-day’s drive of 50% US population • Good air connections, but lacks strong international access • Local Transportation Access • Limited, but gradually expanding public transit system • Convergence of 6 interstates: “Nexus” & “Noose” • East-west connectivity issues • Parking • Accelerating need for parking management & access • Physical Conditions • Topography & flooding • Important architectural heritage but “missing teeth” • Sporadic but limited “identity marketing” urban design
EXISTING INVENTORY • Industrial: 9.0 million sq. ft. • Office: 7.9 million sq. ft. • Housing: 5,900 units • Retail: 1.5 million sq. ft. • Convention: 1.2 million sq. ft. • Hotels: 2,500 rooms • Government & Community: 150+ • Parking lots 754 • Vacant lots 1,560 • Audience Support: • Museums 4 (+2 planned) • Performing arts venues 6 • Multi-use & sports venues 5 • Commercial entertainment 46 (650,000 sq. ft.) • Historic/Visitor attractions 11 • Parks & trails 4
ECONOMIC OVERVIEW • Diversified regional economic base • Concentrations in health care, accommodation services, and retail trade • 6.7% employment growth since 1998 • 100,000 jobs added 1998-2007 • 60,000 jobs lost 2007-2010 • Declining industries • Manufacturing: -36% (-30,000 jobs) • Construction -10% (-3,600 jobs) • Growing industries • Health care +35% (+27,300 jobs) • Accommodation +31% (+16,000 jobs) • Management +49% (+8,600 jobs)
OFFICE – Existing Market • Downtown Mix • State Government • Banks & financial institutions • Law firms • Corporate • Technology • Media
OFFICE – Existing Market • Absorption Trends • 640,000 sf / year (96-11) • 840,000 sf / year (07-11)
OFFICE – Demand Forecasts • Office Employment Projections (MSA): 2012-2021 • Growth: 27,100 (19.5%) • Prof/Technical Services • +12,700 jobs (33.2%) • Management Services • +5,900 jobs (22.1%)
OFFICE – Demand Forecasts • Competitive Framework • Cool Springs-Brentwood • Franklin Park • Airport • Buchanan Point • Midtown • West End Summit • 1515 Demonbreun • One City / Charlotte Medical Corridor
OFFICE – Market Potential • Potential: 564,000 – 745,000 sq. ft. by 2022 • Equal to 1 “Batman” Bldg or 2 SunTrust Plazas • Escalating trend of Re-urbanization • Demand Drivers: • Professional, scientific & IT/technical services • Management services • Media & entertainment • Others: Health care, FIRE • Growing Base: • Small IT, entertainment & service firms
OFFICE – Downtown Districts • Gulch • Interstate access • Proximity to health centers • Downtown • State Government draw-down • Pro-active recruitment • So Bro • Information & Media Services 38,400 – 50,800 square feet • Professional & Technical Services 34,200 – 70,600 • Management Services 26,100 – 28,600 • Medical Offices 23,700 – 25,800 • Finance & Insurance 20,300 – 20,600 • Real Estate 6,100 - 27,700
OFFICE - Caveats & Prerequisites • Create space to accommodate smaller, emerging “footloose” firms • Create supportive environment for office tenants • Provide sufficient parking & transit • Ameliorate State Government drawn down (20%) • Reduce space /change use in functionally-obsolescent buildings • Pro-active marketing & recruitment can result in “drop ins”
HOUSING – Existing Market • Diverse central city neighborhoods • Rutledge Hill • The Gulch • Rolling Mill Hill • SoBro • Germantown • Salemtown • Hope Gardens • Capitol Hill (Sulphur Dell, N Capitol, Market District) • Downtown
HOUSING – Existing Market • Downtown Market Drivers • Young, Single Prof. & “DINKS” • Downtown Workers • Students & Parents • Investors • Empty Nesters • “Transitionals”
HOUSING – Existing Market • CBD Rental Market • High occupancy • 92% (2009) – 98% (2012) • CBD highest in region • Rents • $1.95 psf average • Absorption • 140 – 160 units / month • 30 units / mo / project • CBD For-Sale Market (2011-12) • Ave SF: 1,260 • Ave Sale Price: $196,070 • Ave Sale/SF: $156 • # Sales: 630/year • # Condos on market: <10
HOUSING – CBD Employee Survey • Demographics • 94% have attended college • 1/3 have advanced degrees • Diverse incomes • 40% work in Government, 12% in non-profits • 16% work in law firms • 77% are home owners; Only 21% are renters
HOUSING – CBD Employee Survey • 8% already live downtown • Another 30% would consider living downtown • Highest propensity: • Antioch • Hermitage • West Meade • Old Hickory • Bellevue • Crieve Hall/Glencliff • S Nashville/Woodbine • Reason to live downtown: • Closer to work: 43% • Closer to city life: 34% • N/A or Already in CBD: 17% • Other reasons: 5% • Closer to friends/people: < 1%
HOUSING – CBD Employee Survey • Preferences • Historic or consistent with neighborhood character • Home ownership • Single-family: 54% • Detached: 31% • Attached: 23% • Affordable • $2,200 / month average • 1/3 < $1,000 / month
HOUSING - Demand • Competitive Framework
HOUSING – Market Potential • Potential: 3,530 housing units in Loop by 2017 • 2,200 move-ups / move-downs • 1,330 growth-generated (600 relocations) • Product: • Detached Single-Family Homes 650 DU • Attached Single-Family/Brownstones 505 • Lofts/Units in Mixed-Use Buildings 500 • Condominiums 400 • Multi-family Apartments 1,480
HOUSING- Districts • Northside Neighborhoods (Germantown, Capitol Hill, Buena Vista, Salemtown) • Single-family attached & detached • Mid-rise lofts, mixed-use • SoBro/Rolling Mill Hill • High-rise apartments and condominiums • Loft/Mixed-use, Mixed-income buildings • Single-family attached (e.g., brownstones) • Gulch/Downtown • High-rise apartments and condominiums • Conversions of office space • Mixed-use
RETAIL – Existing Market • CBD Area Rents • Downtown Core $17.19 per square foot • SoBro $14.29 • Germantown $15.42 • East $12.50 • Gulch $26.00 • Sales (per business interviews) • Average $207psf • Growth +1.7%/annum • Increasing 63% • Declining 17%
RETAIL – Existing Market • Key Issues • Parking accessibility & pricing • Dominance of dining & entertainment • Dependency on events & tourism • CMA Fest is “Christmas” • Heavy dependence on Bridgestone Arena • Limited (but growing) regional market appeal • Lack of shopping “district” • Parking / traffic • Lack of anchors
RETAIL - Demand • Trade Area: • $4.2 Billion forecasted growth in income by 2017 • $2.5 Billion growth in expenditure potentials • Visitors: • $117.5 million growth • Downtown Workers: • $53.7 million growth • Students: • $1.0 million growth
RETAIL • Key anchor uses • Cinemas • Musical theatre entertainment • Local Brands • Jack Daniels, Goo Goo Clusters • “Artisan” industrial * • Toy, hobby & game store • Department / GM store (“General store” concept) • Sporting goods store • Apparel & accessory stores • So Bro • Mixed-use, anchored shopping district (3-5 blocks) • Lafayette Street
HOTELS - Demand • Leisure Travel • Sightseeing is 45% of all visits to Nashville • 1,130,000 estimated out-of-town visitors to CBD attractions (2011) • 84% of overnight visitors stay in hotels • Business Travel • Estimated 390,000 convention attendance in 2012, increasing to 516,000 by 2016 (MCC).
HOTELS – Planned Development • CBD Area – 4,000+ rooms • Omni Nashville – 800 rooms • Hyatt Place-255 • Gulch – <450 • Eakin Partners (270+/-) • Vision Hospitality (150+/-) • Hilton Harden Inn-200 • Giarrantana-315 / Marriott • Trail West (Westin)-475 • Others: • White Lodging (4*) • Pinnacle Hotels • 5th Ave/KVB • 415 4th Avenue • Matthews/Northpoint (5th/KVB) • Platinum Hosp (406 6th ) • Arizona investors 432 6th • Competition • Homewood Suites-192 • Residence Inn/Spring Hill Suites • Intercontinental
HOTELS – Comparables • 4,100 rooms near MCC with 1,740 existing & 2,400 planned “known” hotel rooms • Yields ratio of 0.011 rooms/SF convention space. • Roughly equal to comparables average of 0.012 rooms/SF
HOTELS - Potentials • Demand for +361,500 room-nights by 2017 • Potential for +2,590rooms in SoBro area • 2,460 “known” rooms planned in SoBro area • Classification Mismatch: • Only 2 planned hotels are full-service properties with 300+ rooms, as needed by convention planners
INDUSTRIAL – Existing Conditions • Industrial is largest land use in CBD study area • ICBD is 2nd largest regional industrial sub-market • ICBD vacancy is only 5.9%, lowest of all sub-markets • Industrial absorption rebounded in 2011 • CBD is competitive for machine shops, repair services, wholesale supply, recycling, transportation services, showroom space, & specialty niche manufacturing spaces • Despite decline in manufacturing overall, growth in niche industries, i.e., food & beverage
INDUSTRIAL - Opportunities • SoBro “Artisanal” Manufacturing Uses • Whiskey distilleries • Micro-breweries • Specialty bakeries • Confectionary manufacturers (chocolate and non-chocolate) • Artisanal / regional food manufacturers • Craft furniture and furnishings designers, producers & wholesalers • Small specialty lighting and electrical equipment manufacturers • Craft paper, bookbinding and specialty printing companies • Visual artists and sculptors • Craft toy and game producers • Clothing, footwear, jewelry and accessory designers and producers • Specialty regional meat producers/butchers (e.g., smoked hams) • Record & DVD pressing companies • Film production companies