
Multiple Regression
Multiple Regression. The standard score (Z-score) of Y is predicted by a number of X variables, also expressed as standard scores. The predictors are weighted by coefficients, called Beta weights.

Multiple Regression
E N D
Presentation Transcript
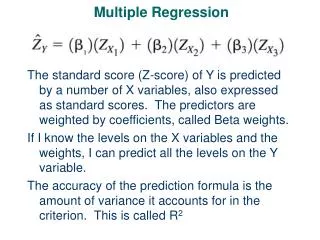
Multiple Regression The standard score (Z-score) of Y is predicted by a number of X variables, also expressed as standard scores. The predictors are weighted by coefficients, called Beta weights. If I know the levels on the X variables and the weights, I can predict all the levels on the Y variable. The accuracy of the prediction formula is the amount of variance it accounts for in the criterion. This is called R2
Multiple Regression Let’s conduct a multiple regression and examine what happens as we add predictors to a regression formula. What does it mean to “account for variance”? 1. Download The Job Salary data (salary.sav) 2. Run Descriptives for Current Salary and check the box Save Standardized Values. This saves the variable as a set of Z scores 3. Run Histograms for the Current Salary Z scores. This is the variance we want to explain. 4. Run Regression - Linear. Use Current Salary as the criterion and Education as the Predictor. Choose Plots & indicate you want a histogram of the residuals. 5. Run further regressions and add Beginning Salary, Work Experience and Sex. Notice what happens to the residual histogram. 6. Finally, make a few small changes to the standardized Current Salary variable and add it as a predictor.
Multiple Regression Redundancy among predictors: 1. Download The Job Salary data (salary.sav) 2. Run Bivariate correlation and correlate all the relevant variables. Examine the Pearson correlations 3. Run Regression - Linear with Current Salary as the criterion and Education as the predictor. 4. Next, add Sex of Employee and examine the increase in the multiple R. Education and Sex of Employee must predict some of the same variance in Current Salary How do I know which variables to enter into the analysis? Should I just enter them all together? Should I develop a sequence of adding the predictors to the analysis?
Multiple Regression Hierarchical and Stepwise Methods of including predictors. How do we know which predictors to enter, and in which order? If the predictors have a logical order, such as Time, or type of variable, they should be included sequentially by this order. This is referred to as hierarchical regression. If the predictors are entered sequentially by how much each adds to the variance accounted for then the method is called stepwise regression. Which method is best? Conduct hierarchical and stepwise regression with the salary.sav data set.
Partial Correlation What is the correlation between variable X and variable Y if I hold variable Z constant? What is the correlation between Current Salary and Sex of the Employee if I hold Education constant? What is the correlation between Current Salary and Sex of the Employee if I control for Education? Conduct a partial correlation on these variables using SPSS. Note the similarity between partial correlation and multiple regression.
Reliability The consistency of measurement. How much error is embodied in the measurement tool? Cronbach’s Alpha: How well do items in a scale systematically interrelate? Test-retest reliability Split-half reliability Inter-rater reliability
Reliability Download the Williams Picture Vocabulary Test data set and calculate split-half reliability and Cronbach’s alpha using SPSS.
Reliability Download the Williams Picture Vocabulary Test data set and calculate split-half reliability and Cronbach’s alpha using SPSS.


