Download
1 / 14
290 likes | 552 Vues
This course offers a comprehensive yet rapid introduction to MATLAB and Simulink, essential tools for system modeling, simulation, and control. Over two weeks, participants will learn about matrix programming, structured programming, and system simulation in Simulink. The training includes hands-on lab sessions to enhance practical skills, ensuring participants are proficient in developing MATLAB and Simulink programs. Key resources, including MATLAB toolboxes and extensive online help, will be provided to support learning and application in real-world scenarios.

E N D
Introduction to Matlab and Simulink Dr Martin Brown E1k, Control Systems Centre School of Electrical and Electronic Engineering University of Manchester Tel: 0161 306 4672 martin.brown@manchester.ac.uk EEE Intranet
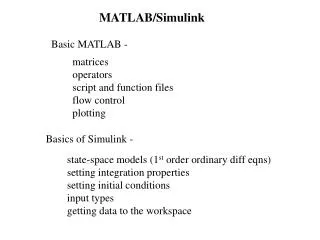
Background and Aims • Matlab and Simulink have become a defacto standard for system modelling, simulation and control • It is assumed that you know how to use these tools and develop Matlab and Simulink programs on this MSc. • Over the next two weeks, we’re going to have a rapid introduction to Matlab and Simulink covering: • Introduction to Matlab and help! • Matrix programming using Matlab • Structured programming using Matlab • System (and signal) simulation using Simulink • Modelling and control toolboxes in Matlab • Note that we’re not covering everything to do with Matlab and Simulink in these 4*2 hour lectures • Also, after every lecture block in this module, there is a 1 hour lab scheduled – programming is a practical activity
Resources • Mathworks Information • Mathworks: http://www.mathworks.com • Mathworks Central: http://www.mathworks.com/matlabcentral • http://www.mathworks.com/applications/controldesign/ • http://www.mathworks.com/academia/student_center/tutorials/launchpad.html • Matlab Demonstrations • Matlab Overview: A demonstration of the Capabilities of Matlab http://www.mathworks.com/cmspro/online/4843/req.html?13616 • Numerical Computing with Matlab http://www.mathworks.com/cmspro/online/7589/req.html?16880 • Select Help-Demos in Matlab • Matlab Help • Select “Help” in Matlab. Extensive help about Matlab, Simulink and toolboxes • Matlab Homework Helper http://www.mathworks.com/academia/student_center/homework/ • Newsgroup: comp.soft-sys.matlab • Matlab/Simulink student version (program and book ~£50) http://www.mathworks.com/academia/student_center • Other Matlab and Simulink Books • Mastering Matlab 6, Hanselman & Littlefield, Prentice Hall • Mastering Simulink 4, Dabney & Harman, Prentice Hall • Matlab and Simulink Student Version Release 14 • lots more on mathworks, amazon, …. It is important to have one reference book.
Introduction to Matlab • Click on the Matlab icon/start menu initialises the Matlab environment: • The main window is the dynamic command interpreter which allows the user to issue Matlab commands • The variable browser shows which variables currently exist in the workspace Command window Variable browser Command history
Matlab Programming Environment • Matlab (Matrix Laboratory) is a dynamic, interpreted, environment for matrix/vector analysis • Variables are created at run-time, matrices are dynamically re-sized, … • User can build programs (in .m files or at command line) using a C/Java-like syntax • Ideal environment for model building, system identification and control (both discrete and continuous time • Wide variety of libraries (toolboxes) available
Basic Matlab Operations • >> % This is a comment, it starts with a “%” • >> y = 5*3 + 2^2; % simple arithmetic • >> x = [1 2 4 5 6]; % create the vector “x” • >> x1 = x.^2; % square each element in x • >> E = sum(abs(x).^2); % Calculate signal energy • >> P = E/length(x); % Calculate av signal power • >> x2 = x(1:3); % Select first 3 elements in x • >> z = 1+i; % Create a complex number • >> a = real(z); % Pick off real part • >> b = imag(z); % Pick off imaginary part • >> plot(x); % Plot the vector as a signal • >> t = 0:0.1:100; % Generate sampled time • >> x3=exp(-t).*cos(t); % Generate a discrete signal • >> plot(t, x3, ‘x’); % Plot points
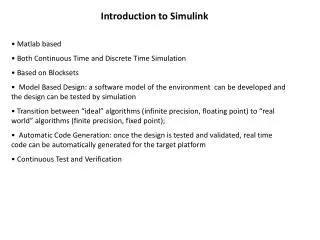
vs, vc t Introduction to Simulink • Simulink is a graphical, “drag and drop” environment for building simple and complex signal and system dynamic simulations. • It allows users to concentrate on the structure of the problem, rather than having to worry (too much) about a programming language. • The parameters of each signal and system block is configured by the user (right click on block) • Signals and systems are simulated over a particular time.
Starting and Running Simulink • Type the following at the Matlab command prompt • >> simulink • The Simulink library should appear • Click File-New to create a new workspace, and drag and drop objects from the library onto the workspace. • Selecting Simulation-Start from the pull down menu will run the dynamic simulation. Click on the blocks to view the data or alter the run-time parameters
Signals and Systems in Simulink • Two main sets of libraries for building simple simulations in Simulink: • Signals: Sources and Sinks • Systems: Continuous and Discrete
Basic Simulink Example • Copy “sine wave” source and “scope” sink onto a new Simulink work space and connect. • Set sine wave parameters modify to 2 rad/sec • Run the simulation: • Simulation - Start • Open the scope and leave open while you change parameters (sin or simulation parameters) and re-run • Many other Simulink demos …
Day 1: Matrix Programming in Matlab • Full notes/syntax will be recorded in the diary • Setting directory and diary • Simple maths • Matlab workspace, and help • Variables, comments, complex numbers and functions • Matlab desktop and management • Script m-files • Arrays • Creating and assigning arrays, standard arrays • Array indexing and orientation • Array operators • Array manipulation • Array sorting, sub-array searching and manipulation functions • Array size and memory utilization • Control structures • for and while loops • if else and switch decisions
Day 2: Structured Matlab Programming • Full notes/syntax will be recorded in the diary • Functions • Input and output arguments • File structure, search path • Exception handling • Debugging and profiling • Strings • Dynamic function and expression evaluation • Cell arrays • Data structures • Data plotting (2D/3D), figures • GUIDE • Simulink
Day 1: Laboratory • Remember • Change directory to your local filespace so that your work is saved • Turn on the diary on to save the commands and results from the lab session to a file for future reference • Questions • Use the help and lookfor commands and look at the normal Matlab help section in the pull down menu (F1). How does the sin() function work? • Evaluate expressions such as 7*8/9, 8^2, 6+5-3 • Using the in-built Matlab functions, evaluate sin(0), sin(pi/2), abs(-3) • Using the editor, write a Matlab script to solve the quadratic equation • 2x2 -10x + 12 = 0 • Evaluate, using a for loop, the first twenty numbers of the Fibonacci series • xn = xn-1 + xn-2, x0 = 1, x1 = 1 • Create the two vectors [1 2 3], [4 5 6] and calculate their inner product • Create the 3*3 matrix A = [1 2 3; 4 5 6; 7 8 9] and the column vector b = [1 2 3], and multiply the two together A*b. • Solve the equation A*x = b, where A and b are given in (6) • Modify (8), so that you neglect the 3rd row & column of information. • … http://www.facstaff.bucknell.edu/maneval/help211/exercises.html
Day 2: Laboratory • Write a function that returns the two roots of a quadratic equation, given the three arguments a, b and c. Test the function from the command line • Write a function that returns the mean and standard deviation of a vector of numbers (input vector). While Matlab supplies the mean() and std() functions, try just using the sum() and length() functions. • Write a function that reverses the order of letters in a string, and returns the new string. • Use the eval() Matlab function to evaluate strings such as: • exp1 = ‘5*6 + 7’; • Note this, and feval(), is very useful for dynamic programming • Use a cell array to store a list of expressions, stored as strings. Then use eval() and a for loop to iterate over the expressions and evaluate them. • Create two simple data structures to modify your solution to (1). Use one data structure to pack the parameters of the quadratic equation into a single variable, and use another to return the roots inside a single data structure • Create the vector 0:pi/20:2*pi and use it to sample the sin() function. Plot the results and edit the figure window to put labels on the figure. Save the figure (.fig) and export a .jpg file. • Use the meshgrid() function to sample a 2 dimensional input space between 0 and 2p, then use the data to sample the function sin(x1)*cos(x2). Plot the results using the mesh() function. • Create a GUI that prompts the user for a number and then displays double that number next to the entered value. • Start Simulink and using a sin()source and a scope sink, view the signal over 10 seconds. • Change the frequency of the sin() source and again compare the results. Next change the simulation length. • Build the first order system H(s) = 1/(1+3s) in the model and pass a sin() signal through the system. Make sure you run the simulation for a long enough time for the transients to die down and the system to settle. • Replace the first order system in (6) with the second order system, what is the difference when the system settles down H(s) = 1/(1+2s+s^2).