
pcfs4-1
E N D
Presentation Transcript
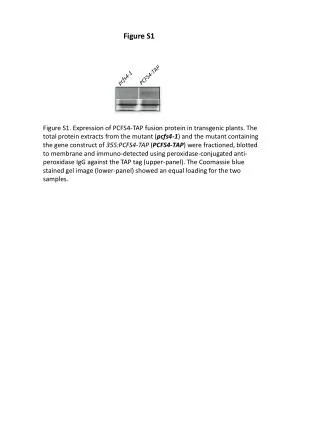
Figure S1 Figure S1. Expression of PCFS4-TAP fusion protein in transgenic plants. The total protein extracts from the mutant (pcfs4-1) and the mutant containing the gene construct of 35S:PCFS4-TAP (PCFS4-TAP)were fractioned, blotted to membrane and immuno-detected using peroxidase-conjugated anti-peroxidase IgG against the TAP tag (upper-panel). The Coomassie blue stained gel image (lower-panel) showed an equal loading for the two samples. PCFS4-TAP pcfs4-1
Figure S2 Fold Change Figure S2. Verification of the PCFS4-TAP enrichment on the gene loci involved in circadian rhythm. Following the ChIP, the DNA abundance (mean ± stdev) of the PCFS4-TAP enriched sites were determined using qPCR and normalized to the PCFS4-TAP enrichment on Tip41 (the control).
Figure S3 AT5G52910 Gene Model cDNA/EST Log fold enrichment AT5G48890 AT3G26640 Gene Model cDNA/EST Log fold enrichment AT3G22380 Gene Model cDNA/EST Log fold enrichment AT3G20810 Gene Model cDNA/EST Log fold enrichment Figure S3. PCFS4-TAP enrichment sites are associated with the sites where the alternative transcription or pre-mRNA processing occurs. The gene structures are represented by blue bars (light blue bars for 5’ and 3’ UTR) and lines (Gene model). The cDNA/ESTs supporting the gene model are represented by green bars (cDNA/EST). The vertical black bars represent the PCFS4-TAP enrichment (Log fold enrichment)along the gene body. The red frames highlight the regions where the ES site are associated with alternative transcription or pre-mRNA processing supported by cDNA/ESTs.