Download
1 / 45
450 likes | 454 Vues
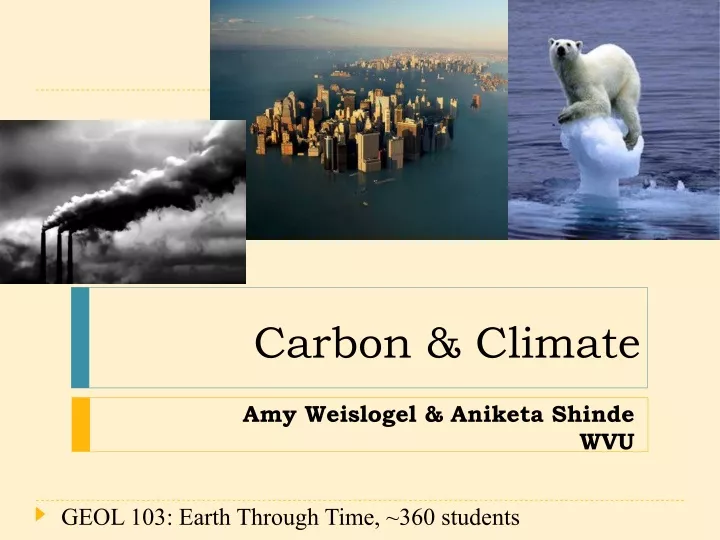
Amy Weislogel & Aniketa Shinde WVU. Carbon & Climate. GEOL 103: Earth Through Time, ~360 students. Learning Goals & Outcomes. Goals: Understand how earth’s climate has warmed and cooled over time due to natural processes and process by which human activities are impacting the climate system

E N D
Amy Weislogel & Aniketa ShindeWVU Carbon & Climate GEOL 103: Earth Through Time, ~360 students
Learning Goals & Outcomes • Goals: • Understand how earth’s climate has warmed and cooled over time due to natural processes and process by which human activities are impacting the climate system • Outcomes: • Discriminate between climate and weather • Predict climate response to changes in CO2 greenhouse gas concentrations in the atmosphere • Know CO2 as a greenhouse gas • Model the carbon cycle • Carbon budget and impact of perturbations on the carbon cycle • Identify ways in which humans can affect change in the concentration of CO2 in the atmosphere
Hook 1:The average air temperature of Earth is the same as the average air temperature of the Moon. • True • False Why?
Greenhouse gases • Atmospheric gases that trap warming solar radiation near Earth’s surface • Without these gases the average temperature on Earth would be 0° F Brrrr!
Dominant Greenhouse Gas:Carbon dioxide – CO2 • A carbon atom bonds with 2 oxygen atoms to form 1 carbon dioxide molecule • Today, CO2 makes up ___ of the total atmosphere. • <0.1 % • 1% • 10% • 50%
Hook 2: CO2 in the atmosphere has changed through time… • Over the last ~650,000 years… • Analysis of air bubbles trapped in ice sheets
UPSHOT: At times… • CO2 left the atmosphere • Where did it go? • CO2 came into the atmosphere • Where did it come from? TODAY!
The Carbon Cycle • A cycle in which carbon moves between the biosphere, lithosphere, hydrosphere and atmosphere How does this happen?
Group Activity • You will receive 2 index cards • Your group is assigned one of the following “spheres” based on the color of your cards: • Hydrosphere (blue) • Lithosphere (pink) • Biosphere (yellow)
7 minutes Group Activity: List processes by which carbon/carbon dioxide moves to/from the atmosphere and your sphere “Your Sphere” From atmosphere to “your sphere”: Idea 1 Idea 2 Idea 3 Idea 4 From “your sphere” to atmosphere: Idea 1 Idea 2 Idea 3 Idea 4 Atmosphere • Blue = Hydrosphere (H) • Pink= Lithosphere (L) • Yellow = Biosphere (B)
Launching thought: • Carbon atoms occupy space in: • *Atmosphere (where it causes warming of Earth’s surface) • CO2 (gas) • Hydrosphere • What forms? • Lithosphere • What forms? • Biosphere • What forms? HOW COULD CARBON MOVE TO/FROM THE ATMOSPHERE?
Listen carefully---- • Hand one copy of your list to another group working on the same sphere (same color) and find another groups “extra” list to compare your ideas with theirs… • Don’t alter the other group’s list, but… • Add ideas to your list that you think are good • Detract ideas from your list that you have reconsidered
Time is up! I’ll select a few groups to send a member to draw their group’s model on the appropriate white board “Your Sphere” • If another group wrote an idea you had, put a star next to it • If another group wrote an idea that you don’t agree with, put an X next to it From atmosphere to “your sphere”: Idea 1 Idea 2 Idea 3 Idea 4 From “your sphere” to atmosphere: Idea 1 Idea 2 Idea 3 Idea 4 Atmosphere
Process (draw) what we’ve learned: What processes put CO2 IN to the atmosphere? • Biosphere in (BIN) • Hydrosphere in (HIN) • Lithosphere in (LIN)
Process (draw) what we’ve learned: What processes take CO2 OUT of the atmosphere? • Biosphere in (BIN) • Hydrosphere in (HIN) • Lithosphere in (LIN)
If the amount of carbon transferred from the lithosphere, hydrosphere and biosphere to the atmosphereequals (is the same as) the amount of carbon transferred to the lithosphere, hydrosphere and biosphere from the atmosphere, then the amount of CO2 in the atmosphere will: • Increase • Decrease • Stay the same
Carbon Budget • Over short time scales, Carbon is neither created nor destroyed (in significant amounts) • Carbon moves through a system at a rate in and a rate out • If rates are equal, then no change to the reservoir LIN + BIN + HIN = LOUT + BOUT + HOUT
Carbon Budget • If rate IN is faster than rate OUT, amount of carbon dioxide in the atmosphere increases LIN + BIN + HIN > LOUT + BOUT + HOUT
Carbon Budget • If rate OUT is faster than rate IN, amount of carbon dioxide in the atmosphere decreases shrinks LIN + BIN + HIN < LOUT + BOUT + HOUT
Carbon dioxide through time: • Geological evidence suggests CO2 levels change through time: LIN + BIN + HIN ≠ LOUT + BOUT + HOUT
Which equation describes the carbon budget from 375-300 Ma? LIN + BIN + HIN = LOUT + BOUT + HOUT LIN + BIN + HIN < LOUT + BOUT + HOUT LIN + BIN + HIN > LOUT + BOUT + HOUT
Think-Pair-Share • What could could have caused the sharp decrease in CO2 from 375-300 Ma? LIN + BIN + HIN < LOUT + BOUT + HOUT
Carbon dioxide through time: • What would be the concentration of CO2 in the atmosphere ~550 Ma if today’s CO2 concentration is 390 ppm? • ~16 ppm • 390 ppm • 3900 ppm • 9750 ppm ppm = parts per million
Humans are now taking carbon from the lithosphere, making CO2 and releasing it to the atmosphere…..
Hook • Should CO2 be regulated as a pollutant? • What do you know? • What do you need to know? • Is anthropogenic input of CO2 into the atmosphere causing global warming? • If so then regulation may be good • Is anthropogenic input of CO2 having no effect on global temperature? • If so then regulation a waste of time and energy
The total mass of atmospheric carbon dioxide is 3.16×10¹⁵ kg (about 3,000 gigatonnes) • Humans are adding approximately 9 gigatons/year • 3 is used up by photosynthesis • 2 is absorbed by the ocean • 4 gigatons/year remain
Carbon dioxide through time: • Geological evidence suggests CO2 levels up to 25x higher than today existed in the past
Chemical Reservoirs Feedback: • a self-regulatory system, in which the output affects the input, either positively or negatively • Negative feedback opposes expansion • Positive feedback accelerates expansion
CO2 added to the atmosphere due to burning fossil fuels causes warmer temperature. These warmer temperatures increase plant growth across the planet; to grow, plants take carbon from the atmosphere. This is an example of a: • Positive feedback • Neutralizing feedback • Negative feedback • Isotopic shift
Global Climate Change • Paleoclimates – Past climates are indicated by Earth materials that are climate-sensitive. • Geologic records: Sequences of strata • Depositional environments are often climate-sensitive. • Coral reefs – Tropical marine. • Glacial tills – Cold and continental.
Carbon Isotopes • Marine phytoplankton • Preserved in times of anoxia • Store 12C • Enrich oceans in 13C
Carbon Isotopes • Terrestrial plant ecosystems work the same way • Preserved in times of anoxia • Store 12C • Enrich atmosphere in 13C
Carbon Isotopes • Isotopic excursion — A positive or negative shift in an isotopic ratio through a succession of stratigraphic layers. • Sample limestone and measure stable C isotopes • Preserved in times of anoxia • Enrich oceans in 13C, growth and burial of phytoplankton occurring
Around 300 Ma, there was much more carbon-13 in the atmosphere than carbon 12. Why? • Abundant plants grew in coal swamps • Many plants went extinct and so not many plants were growing • Coal seams were weathered or burned, releasing carbon 13 to the atmosphere
Carbon Isotopes • Isotopes in limestone (CaCO3) • Phanerozoic record indicates intervals of great change • Late Carboniferous swamps buried lots of carbon • Excess 13C in atmosphere and oceans
Frozen Methane • CH4 • Most produced by prokaryotes • Herbivore flatulence • Significant warming • Stored frozen on sea floor and deep under tundra • Low temperature, high pressure formation • Also found on continental slope (400–1000 m w.d.)
Carbon in methane produced by bacteria will be rich in carbon12. δ13C is the ratio of 13C/12C. Big numbers mean more 13C, small numbers mean more 12C.If abundant frozen methane melts and is released to the atmosphere, how with the δ13C value of the atmosphere change? • δ13C will decrease • δ13C will increase • δ13C will stay the same
Frozen Methane • Release of frozen methane releases carbon • Water at depth warms • Rapid release of greenhouse gases (methane) • Positive feedback • Continue to warm • Signal is 12C dominated
Carbon Isotopes • Weathering of CaCO3 releases Ca++ and HCO3- • Carried to oceans • Precipitate limestone skeletal material • Carbon is stored for long time period • Released upon subduction