What Do You See?
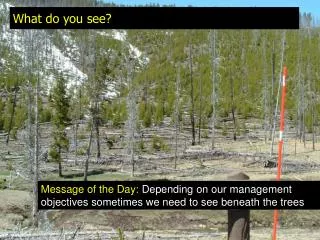
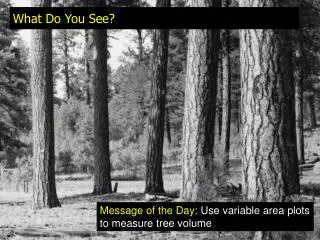
What Do You See?. Message of the Day: Use variable area plots to measure tree volume. Variable Radius Plots Measuring BAF Measuring Basal Area Sites Density and Stocking Measures. FOR 274: Forest Measurements and Inventory. Fixed and Variable Area Plots: A Note on Probability.

What Do You See?
E N D
Presentation Transcript
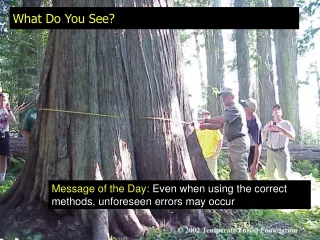
What Do You See? Message of the Day: Use variable area plots to measure tree volume
Variable Radius Plots • Measuring BAF • Measuring Basal Area • Sites • Density and Stocking Measures FOR 274: Forest Measurements and Inventory
Fixed and Variable Area Plots: A Note on Probability • To obtain information about a stand it is very common to sample the area with plots • In fixed area plots the probability of selecting a tree about the plot center is constant for all trees • Sampling methods exist where the decision to include a tree in a plot depends on the size of that tree • These are called probability proportional to size (PPS) methods. PPS methods are used to measure stand volume as the selection probability of the tree will be proportional to its basal area.
Fixed and Variable Area Plots: The Factor Concept In forestry we often summarize data in terms of measures per plot but often we really want a per acre measure To convert from per plot to per unit acre we scale the measures by a factor TF = Unit Area (Acre) / Sample Area (Plot) TF = Tree Factor Unit Area = 43,560 ft2 or for metric: 10,000 m2 Sample Area = size of plot (ft2 or m2)
Fixed and Variable Area Plots: The Factor Concept Therefore, each tree selected for measurement represents *TF* trees per units area: hence “Tree Factor” For this 1/10th acre square plot each measured tree “represents” 10 trees per acre.
Expansion Factors: The Basal Area Factor (BAF) The Basal Area Factor (BAF) is the number of units of basal area per unit area represented by each tailed tree BAF = Basal Area * Tree Factor (TF) BAF = 0.005454*(DBH)2*(unit area/plot area) BA per unit area = SUM (BAF) = TF * SUM (BA of all trees) In fixed area plots, the Tree Factor is constant making the calculation of basal area easy.
Variable Area Plots: Calculating the BAF In variable radius plots calculating the BAF is more tricky as the sample area is not constant. In variable probability (or variable area) plots: probability of selecting a tree depends on the size of the tree Source: Husch Beers and Kershaw
Variable Area Plots: Calculating the BAF Plot radius is proportional to tree diameter: For trees right at edge the Ratio of Diameter (D) to Radius (r) = a Constant, k At the edge of the plot the constant, k = 2 sin (θ/2) By working through the calculations (p275) we find: BAF = 10890*k2
BAF: Calculating BAF from an angle For an object of fixed width, held a fixed distance away from your eye you can work out the angle θ: Thumb: 2/3 “ held at 24” away θ = tan -1 (half width / distance) = 0.3333/24 θ = 0.79° k = 2 sin (θ/2) = 0.014 BAF = 10,890 k2 = 2.13 Therefore your thumb “represents 2.13 units of basal area for each tree measured”
BAF: Calculating Whether Trees are In For a known BAF, say 10, we can work out k 10 = 10,890 k2 k = 0.0303 For known tree diameters: We can work out the maximum (or limiting) distance a tree can be at to be “Included” within the plot Remember: k = D/r therefore, r = D/k For example a 10” tree will be “in” if within: r = 10/0.0303 = 330” = 27.5 feet
BAF: Calculating Whether Trees are In To make things easier, we often use limiting distance tables to calculate whether the trees are IN or OUT of the plot.
Variable Probability Plots: Horizontal Point Sampling • The Method: • Observed stands at plot center • Uses a device to projects an angle horizontally to each tree – aiming at DBH height • All trees with diameters > apparent object width are counted • Then scale all measures to per unit area using the BAF
Thinking About Measurements: Basal Area • Prisms • Most commonly used sighting angle gauge • Relatively inexpensive • “Built-in” method for correcting for slope • Infinite number of BAFs available. • Offsets the viewed image slightly
Thinking About Measurements: Basal Area • Trees is counted if its image overlaps the image seen above and below the prism • Borderline trees • Trees not counted if image does not overlap
Thinking About Measurements: Basal Area Prisms and Slope:
Select BA Factor (5, 10, 20, 40) to ensure tally of 5-12 trees • Center eye over Plot Center • Hold chain ‘like an archer’ and aim the gauge at the target trees’ breast height • Circle around plot center and aim gauge at tree’s DBH • If tree DBH > Angle Gauge Width ADD to tally • BA/unit area = BAF * Tally Basal Area: The Angle Gauge
Forest Descriptions: Overview • The forests we measure are usually described by common terminology. • Stand: A contiguous group of trees sufficiently uniform in some way (age distribution, composition, structure) and growing on a site of sufficiently uniform quality, to be a distinguishable unit • Cohort: A distinct aggregation of trees originating from a single natural event or regeneration activity, or a grouping of trees • Rotation: The period of time required for an entire stand to be successfully established, grown, harvested, and re-established. • Succession: A series of dynamic changes by which organisms succeed one another through a series of plant community (seral) stages leading to potential natural community or climax • Stand Structure: Often described by the 4 stage Oliver and Larson (OL) model of stand initiation, stem exclusion, understory re-initiation, and old growth. • Definitions from: http://oak.snr.missouri.edu/silviculture/silviculture_terminology.htm • Free online silvaculture book: http://forestry.sfasu.edu/faculty/jstovall/silviculture/index.php/silviculture-textbook O’Hara et al (1996), http://forestry.sfasu.edu/faculty/jstovall/silviculture
Forest Descriptions: Stand Initiation • Fast Facts: • Generally produced following a stand-replacement disturbance. • At the end of the stand initiation phase the growing space is completely occupied. • Generally one cohort with a single canopy stratum, although may have gaps • Cohort is young and trees per acre generally very high. • Live crown ratios ~ 100%. • At start no nutrient or growth limitations present. aaa O’Hara et al (1996), http://forestry.sfasu.edu/faculty/jstovall/silviculture
Forest Descriptions: Stem Exclusion • Fast Facts: • The young / large trees per acre cohort will reach a point where no new individuals establish and some of the older trees die. • In Open Stem Exclusion competition by sub-canopy species causes breaks in the dominant species canopy cover by limiting the establishment of new dominant trees. In Closed Stem Exclusion new trees are generally limited by lack of light due to near complete canopy closure. • Live crown ratios drop below 100% and understory becomes very shaded. • Mortality is driven by density and nutrient limitations. O’Hara et al (1996), http://forestry.sfasu.edu/faculty/jstovall/silviculture
Forest Descriptions: Understory Re-initiation • Fast Facts: • As the stand growth continues, a new cohort initiates in the understory as gaps appear in the canopy of the older cohort. These gaps occur from density independent mortality (e.g., fire, insects, wind throw, etc.,). • Multi-story stand, with overstory of snags, poles, or large trees and understory of seedlings and saplings. • Snags and large woody debris often present. • Shade tolerant species become established. O’Hara et al (1996), http://forestry.sfasu.edu/faculty/jstovall/silviculture
Forest Descriptions: Old Growth • Fast Facts: • Late in the lifecycle of a stand, old trees will die off allowing some trees in a younger cohort to also occupy the overstory • Live trees with large branches and large diameters present • Large amounts of snags and large woody debris present • Disease and rots present in many trees O’Hara et al (1996), http://forestry.sfasu.edu/faculty/jstovall/silviculture
Site: the environment or area where a tree or stand grows The characteristics of a site drive the type, quality, and quantity of vegetation that can exist there Sites: What is a Site Anyway? Avery and Burkhart Chapter 15
Sites: Why do we Make Site Measurements? An inherent property usedto predict the “potential” of a given site to produce products under a given management prescription • Historical records of productivity data do not exist for many forests • Several factors affect productivity: • Soil nutrients, light availability, topography, etc • This leads to indirect methods Avery and Burkhart Chapter 15
Sites: Tree Height as a Site Measurement • Relations between Tree Height and Age: • Practical & Consistent • Sensitive to site characteristics • Relatively insensitive to thinning intensity • Strongly related to volume We define this measurement of a site as a Site Index Avery and Burkhart Chapter 15
A site index tells us how fast trees grow in height, diameter, and crown widths and how fast a yield will be obtained from the site Yield: The total amount available for harvest at a given time Growth: Incremental increase in a unit time interval Sites: Tree Height as a Site Measurement
Sites: Tree Height as a Site Measurement Site Index: Average total height of dominant and codominant trees in well-stocked even-aged stands When relations between tree height and age have been established for certain species we can produce predictive curves Avery and Burkhart Chapter 15
Sites: Species-Specific Height Index Curves Q: Tree is 20 years old and 45 feet, what will be its height at 70 years? Avery and Burkhart Chapter 15
Sites: Species-Specific Height Index Curves Q: Tree is 30 years old and 50 feet, what age will it be when its height is 75 feet? Avery and Burkhart Chapter 15
Sites: Species-Specific Height Index Curves A Note on Age … • Age can be: • Age at DBH • Plantation Age • Total Age • If total age used, remember to add the years of growth to DBH Avery and Burkhart Chapter 15
Sites: Species-Specific Height Index Curves Standard Site Index age values: The height of the stand at which the mean annual growth (as compared to the lifetime of the tree) occurs Western Forests: 100 yrs Eastern Forests: 50 yrs Avery and Burkhart Chapter 15
Sites: Other Index Curves A Soil Depth and Elevation Site Index: Avery and Burkhart Chapter 15
Sites: Measuring Site Trees Site Trees: Dominant or Codominant in even-aged stands with no evidence of damage, suppression, or deformity • Measurements: • Max Tree Height – clino/hypsometer • Tree Age - corer Avery and Burkhart Chapter 15
Sites: Problems with Site Indices • Stand age is difficult to measure precisely and small errors can lead to very LARGE differences • Not optimal in non even-aged stands • Age and Height may not provide enough information in some sites • The values for a site can change due to climate or management activities • Most indices are species specific Avery and Burkhart Chapter 15
Stand Density - stem spacing and separation (e.g., stems per acre) • An important variable that foresters manipulate to develop a stand • Site and Density together define how much timber is expected to be produced Site Density: How Thickly do Trees Grow? Stocking: The degree to which a stand meets a given management objective
Site Density Measures: Basal Area per Acre • Basal Area per Acre: • Easy to understand • Easily measured from point sampling • Highly correlated with volume and growth
Site Density Measures: Trees per Acre • Trees per Acre: • Plantation measure • Limited value in natural stands
Site Density Measures: Relative Spacing Average Distance between trees is divided by height of the dominant canopy RS = [√(43,560/trees per Acre)] / Height Dominant Height
Site Density Measures: Crown Competition Factor Area available to the average tree in a stand as compared to the maximum area it would use if it were open grown
Site Density Measures: The Stand Density Index • Stand Density Index (SDI): • Developed by Reineke in 1933 • Uses diameter, Dq, of tree with the average BA (quadratic mean diameter) and number of trees per unit area (N) Reineke Observed that for each species: Different fully stocked even-aged stands with the same Dq have ~ maximum N
Site Density Measures: The Stand Density Index • Stand Density Index (SDI): • Constant slope • Intercept varies with species log N = -1.605logDq + k N = number of trees per acre Dq = Quad Mean Diameter k = species constant Via Mathematical Gymnastics!!! SDI = N(Dq /10)1.065 Davis Chapter 4
Site Density Measures: The Stand Density Index Use: Parallel Lines - Equal Stand Density Convert number of trees at any quadratic mean diameter, Dq, to the equivalent density at a Dq = 10” Davis Chapter 4
Site Density Measures: The Stand Density Index Maximum SDI by Species in natural stands: Redwood = 1000 Douglas Fir = 595 Longleaf Pine = 400 Stocking = SDI Actual / SDI Maximum Davis Chapter 4