Download
1 / 45
450 likes | 615 Vues
How Large-Scale Flows in the Solar Convection Zone May Influence Solar Activity. David H. Hathaway NASA/MSFC National Space Science and Technology Center Huntsville, AL 2004 October 19. Outline. Outline The Large-Scale Flows Differential Rotation Meridional Circulation

E N D
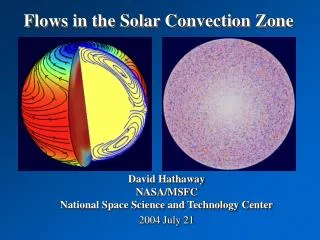
How Large-Scale Flows in the Solar Convection Zone May Influence Solar Activity David H. Hathaway NASA/MSFC National Space Science and Technology Center Huntsville, AL 2004 October 19
Outline • Outline • The Large-Scale Flows • Differential Rotation • Meridional Circulation • Torsional Oscillations • Tachocline Oscillations • Supergranules • Giant Cells
The Large Scale Flows Axisymmetric Non-Axisymmetric Differential Rotation Meridional Circulation Torsional Oscillations Tachocline Oscillations Supergranulation Giant Cells
Large Scale Flows from Synoptic Maps This movie shows the differential rotation (faster at the equator, slower at high latitudes) and both the poleward meridional flow and the equatorwad drift of the active latitudes. The non-axisymmetric flows are hard to discern with 27-day samples.
Photospheric Differential Rotation Sunspot motions and direct Doppler measurements had long ago revealed a rapidly rotating equator and more slowly rotation pole. What mechanism produces this profile? Hathaway et al 1996.
Mechanisms for Maintaining The Latitudinal Differential Rotation The Coriolis force on an axisymmetric flow won’t work – equatorward flows get turned retrograde – slowing down the equator. Poleward flows get turned prograde – spinning up the polar regions. Possible mechanisms must counteract these effects. Non-axisymmetric flows are required. The resulting fluid trajectories can have velocity correlations that produce Reynolds stresses which can maintain a rapidly rotating equator.
Non-Axisymmetric Convection And Angular Momentum Transport Cells elongated east-west give a poleward flux of angular momentum Cells elongated north-south give an equatorward flux of angular momentum
Non-Axisymmetric Convection Early non-linear models (Gilman & Miller 1981) had distinct north-south cells. Recent highly non-linear models (Miesch et al 2000) have less distinct north-south cells but still produce rapidly rotation equators.
Internal Differential Rotation Helioseismic determinations of the internal rotation rate show that the latitudinal differential rotation seen at the surface extends through the convection zone. Layers of strong radial shear are found near the surface and at the base of the convection zone (the tachocline). How is this profile maintained? Internal rotation profile from SOHO/MDI (Howe)
Mechanisms for Maintaining The Radial Differential Rotation The Coriolis force on an axisymmetric flow won’t work – outward flows get turned retrograde – slowing down the surface. Inward flows get turned prograde spinning up the interior. Possible mechanisms must counteract this effect. Non-axisymmetric con-vection gives profiles with rotation constant on cylinders – close – but not good enough. Although penetration into the stable radiative interior is included, no evidence for a tachocline is seen. The surface layers are not included. Gilman & Miller (1981) Miesch et al. (2000)
Surface Shear Layer The surface shear layer is probably due to the effects of rotation on supergranulation. Foukal and Jokipii (1975), Foukal and Gilman (1979), Hathaway (1982), and DeRosa, Gilman, & Toomre (2002) find similar shear layers. The fluid tends to conserve its angular momentum as it moves rapidly (compared to a rotation period) across the layer. DeRosa, Gilman, & Toomre (2002)
Effects of Differential Rotation on Solar Activity • Key dynamo mechanism – converts poloidal fields into intense toroidal fields • Advects active regions • Shears unipolar regions
Photospheric Meridional Flow The direction, the strength, and the structure of the meridional flow were uncertain prior to helioseismology. It is now well established that the flow is predominantly poleward at ~20 m s-1. But it appears to be variable and may have countercells at high latitudes. What drives this flow? Hathaway et al (1996)
Polar Field Reversal at Cycle Maximum The polarity of the polar magnetic fields reverses at about the time of the solar activity maximum.
Internal Meridional Flow Local Helioseismology has revealed aspects of the internal structure of the Meridional Circulation. (Giles et al., 1997; Braun and Fan, 1998; Schou and Bogart, 1998; Basu, Antia, and Tripathy 1999) All of these investigations find a poleward meridional flow of about 20 m/s that persists with depth.
Deep Meridional Flow(Giles 2001) • Inversion of travel times with mass-conservation constraint through the whole convection zone (Giles PhD thesis). • For r/R>0.8 the mean meridional circulation is poleward in both hemispheres and peaks around 25 deg latitude. • The data are consistent with a 3 m/s return flow at the base of the convection zone. Fractional radius r/R
Mechanisms for Maintaining The Meridional Circulation Coriolis force on differential rotation gives a different structure. Reynolds stresses due to correlation between outward and poleward flow works well. Latitudinal pressure gradients may also contribute. Hathaway (1984) Miesch at al. (2000)
Effects of Meridional Circulation on Solar Activity • Key dynamo mechanism • Carries following polarity flux to the poles • May carry toroidal fields in the tachocline equatorward
Latitude Drift of Sunspot Zones We examined the latitude drift of the sunspot zones by first separating the cycles where they overlap at minimum. We then calculated the centroid position of the daily sunspot area averaged over solar rotations for each hemisphere. [Hathaway, Nandy, Wilson, & Reichmann, ApJ 589. 665-670 2003 & ApJ 602, 543-543 2004]
Drift Rate vs. Latitude The drift rate in each hemisphere and for each cycle (with one exception) slows as the activity approaches the equator.
Cycle-to-Cycle Variations The sunspot cycle period is anti-correlated with the drift velocity at cycle maximum. The faster the drift rate the shorter the period. R=-0.5 95% Significant
Drift Rate – Amplitude Correlations The drift velocity at cycle maximum is correlated to the cycle amplitude but a stronger and more significant correlation is with the amplitude of the second following (N+2) cycle. Both of these results were anticipated by the Dikpati & Charbonneau, ApJ 1999, dynamo paper. R=0.5 98% Significant R=0.7 99% Significant
Torsional Oscillations Torsional Oscillations in the rate of rotation were first observed at the surface (Howard and LaBonte, 1980). Early surface observations showed high latitude exten-sions (Snodgrass, ApJ 1985). More recent observations show detatched polar spin-ups at cycle maximum (Ulrich, ApJ 2001).
Torsional Oscillations in the Interior Kosovichev & Schou (1997) found the torsional oscillation signal below the surface. Antia & Basu (2001) follow the equatorward drift in GONG data at 15 Mm depth and see high latitude spin up. Howe et al. (2000) see extensions to 60-70 Mm depth.
Torsional Oscillations and Solar Activity • The may be a symptom of, or reaction to, solar activity • Spruit (2003) suggests that they are a dynamical result of thermal shadows from AR flux tubes
Tachocline Oscillations Howe et al. 2002 found that the shear across the tachocline grew and decayed with a period of about 18 months.
Tachocline Oscillations and Solar Activity • They also may be a symptom of solar activity • However, the time scale of the oscillations is similar to that of other solar activity indicators
The Convective Flows Three layers of convection cells: 1801 Granules – Surface to 1000 km 1954 Supergranules – Surface to 10,000 km 1964 Giant Cells – Surface? to 200,000 km Granules Supergranules Giant Cells?
Granulation Granulation movies from the Swedish Vacuum Solar Telescope in La Palma illustrate the evolving granulation pattern. Typical cells are about 1000 km in diameter with lifetimes of about 20 minutes.
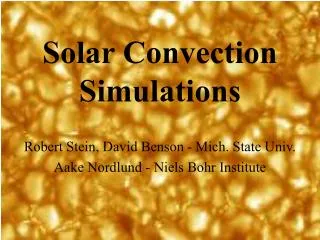
Granulation Simulations The numerical simulations of Stein & Nordlund reproduce the granulation pattern in most details. A “Cork” movie by Fausto Cattaneo shows magnetic elements might be advected into downdrafts.
Supergranulation Supergranulation is seen in Doppler velocity observa-tions and in flow fields constructed with time-distance helioseismology. Typical cells are about 30,000 km in diameter and have lifetimes of a couple days.
Supergranulation in the Interior Duvall et al. (1997) used time-distance helioseismology to show that the supergranulation flows extend several thousand kilometers into the sun.
Supergranulation Simulations Numerical simulations of supergranulation are not as mature as those for granulation. The mechanism that selects cells the size of supergranules is still uncertain. Data simulations can, however, provide important information about the properties of supergranules.
Nordlund & Stein Simulations Correlation Tracking Results Data Simulation Input Data Simulation Observed The Photospheric Convection Spectrum The spectrum has two peaks: one at ℓ~120 (supergranules) and one at ℓ~4000 (granules). There is nothing to indicate an additional component (mesogranules).
Supergranular Diffusion A Diffusivity constructed from the data simulation input spectrum (velocity x wavelength) gives a spectrum that is strongly peaked at ℓ~120 (supergranules).
Supergranulation as a Wave Recent 3D spectral analyses of MDI Doppler-grams suggest that there may be a wave-like prop-erty to supergranulation (Gizon, Duvall, & Schou, Nature 2003; Schou, ApJ 2003). Cells of different sizes rotate at different rates.
Rotation Effects on Supergranules Solar Rotation (27d) is slow for supergranules (40h) and granules (20m). Foukal & Jokipii, ApJ 1975, suggested that with slow rotation fluid will tend to conserve angular momentum and produce a shear layer with rotation increasing inward. Simulations by Gilman & Foukal, ApJ 1979, and by Hathaway, Solar Phys. 1982, confirmed this for supergranulation. A poleward meridional flow at the surface is also produced.
Supergranules and Solar Activity • They sweep magnetic elements to their boundaries and across the surface • They likely play important roles in both the growth and decay of active regions • They likely produce the surface shear layer and a faster meridional flow right at the photosphere
Giant Cells A 3D spectral analysis of MDI Dopplergrams shows a ridge of power that extends down to the lowest wavenumbers. This represents large Doppler features rotating with the Sun. However, the characteristics of these Doppler features are inconsistent with actual flows and do not exhibit other characteristics expected from Giant cells.
Giant Cells as “Sub-Surface Weather” Local helioseismology (time-distance: Zhao & Kosovochev, ApJ 2004; Ring-diagrams: Haber et al., ApJ 2002) shows large velocity features below the suns surface that are more suggestive of giant cells.
Giant Cells from Simulations The highly nonlinear simulations of Miesch et al. (2000) produce complex and rapidly evolving convection patterns. If this is a good represention of giant cell convection on the sun then giant cells cannot be responsible for solar activity phenomena such as active longitudes and activity nests. How would threads of intense magnetic fields alter this situation?
Giant Cells and Solar Activity • They sweep magnetic elements to their boundaries and across the surface • They likely play important roles in both the growth and decay of active regions • They likely produce the latitudinal and radial differential rotation as well as the meridional circulation through out much of the convection zone • Are they responsible for active longitudes and activity nests?
Conclusions • Differential rotation and the meridional circulation are probably driven by giant cells. • The surface shear layer and excess surface meridional flow is probably driven by supergranulation. • The Tachocline shear layer is produced by…? • Torsional oscillations may be driven by thermal shadows from rising flux tubes (Spriut, 2003). • Tachocline oscillations may be driven by…? • Granulation is driven by the ionization/recombination of hydrogen • Supergranulation is driven by…? • Giant cells are driven by the ionization/recombination of metals • What roles do giant cells play in solar activity?