
Comprehensive Guide to Body Composition Metrics
E N D
Presentation Transcript
Overview • A walkthrough of the different metrics • Tips and advice based on clients results • Correct terminology
The colour code system is an indicator of the clients results. Black/Red - Area to focus on Amber/Yellow - Area to improve Green- Healthy Blue- Athletic or Low Baseline The first three metrics are all data inputs, in this scenario the colour blue means they have no health implications
Impedance • Impedance is defined as the strength and speed of the electrical signal travelling through the body and is measured in Ohms • Fat mass is anhydrous in comparison to muscle and acts as a resistor to the flow of an electrical signal
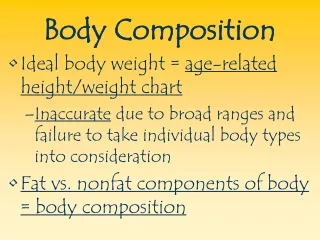
BMI • Body Mass Index (BMI) is a widely used measure, typically used in the medical profession • It is a historical way of assessing your body composition by having your weight divided by your height squared • For most adults an ‘ideal’ BMI is in the range 18.5 to 24.9 • Clients with a high BMI carry higher than recommended levels of fat
Fat Free Mass • Fat Free Mass is the total weight of the body minus the weight of any fat mass measured • This gives an indication of the water, bone, skin and internal organs as a combined weight • Fat Free Mass it is seen to decrease as early as 25 and almost all cases after 40 which is associated with increased risk of falling
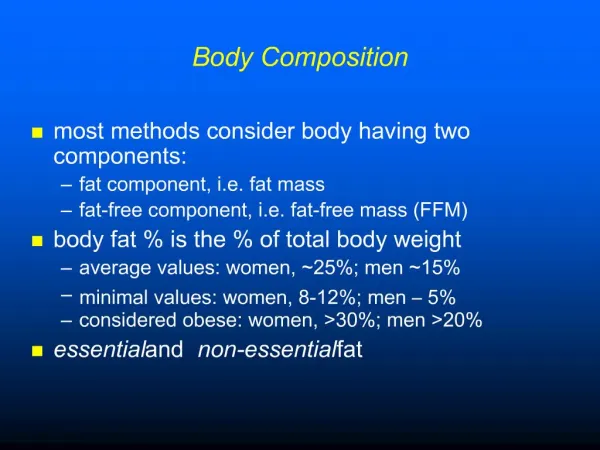
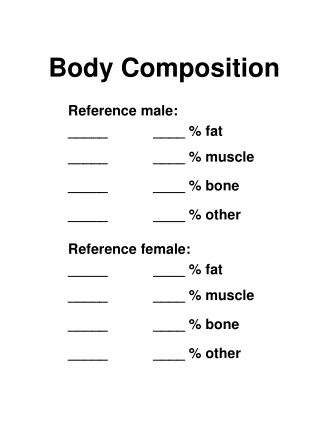
Composition • This is the percentage of body weight. • Muscle, Fat and bone are summed to 100% • Water is separate and is a total body water (TBW) percentage This is the true weight of the metric The colour code system is used to show client’s progress
Trunk is the head, shoulders, chest and abdominal area and will carry the most muscle. Muscle The left and right side balance is often skewed due to possible injury, behaviours and/or posture Muscle is the total mass of the skeletal muscles, smooth muscles and the water contained in these muscles. The mass is the true weight of the muscle and the percentage is the proportion of muscle in that segment This is the distribution of your muscle mass across the 5 segments.
Water Having an ECW >40% can be a sign of having too much body fat due to disruption of the water pathway i.e. storing too much water in the fat. Optimal Ratio: Extracellular 40% - Intracellular 60% Total water mass is the accumulative water content of the body contained in the cells, tissues, blood, bones and organs. Having an ICW >60% is a sign of positive change in body composition. As muscle cells increase in both quantity and size, more ICW is required to power functions. So an increased of ICW, as a result of exercise, is a sign of increased Lean Body Mass This is split into Extracellular (water outside the cells) and Intracellular (water inside the cells).
Men will typically store more fat in their trunk and women will typically store it on their waist and legs, leading to higher readings Fat Fat is essential for maintaining body temperature, cushioning joints and protecting internal organs. A lower percentage of fat in one limb usually means that it is more lean. Blue on the colour scale will not always mean athletic, the client may have a dangerously low level of fat which could imply eating disorders Too much fat can damage your long-term health. But too little fat can lead to osteoporosis, irregular periods in women and possible infertility
Bone It is wise to keep track of your bone mass overtime and check if this is staying constant. There should never be too much change in this reading. This reading is of Dry Fat-Free Bone Mass and indicates the amount of bone (bone mineral, calcium and other minerals) in the body. If their skeleton is red, then it is advised they consult a professional. This would be primarily for the overweight/obese populations. This is NOT bone density, just the true mass of the skeleton.
Basal Metabolic Rate (BMR) • Basal metabolic rate is the minimum amount of calories your body needs to function effectively when at rest • This includes your respiratory system, liver, kidneys and other organs • Increasing muscle mass will speed up your BMR meaning a person with a high BMR burns more calories at rest than a person with a low BMR
BMR Score • BMR Score is a calculation which illustrates how your BMR compares to people of a similar demographic; Age, Height, Gender etc. • It is plot on a scale from 0 to 24, 0 being the lowest and 24 being the highest • 12 is average and therefore is the marker to compare off • The higher your BMR is the higher your score will be
Muscle Score • Muscle score is a calculation which illustrates how your muscle mass compares to people of a similar demographic • It is plot on a scale from 0 to 24, 0 being the lowest and 24 being the highest • 12 is average and therefore is the marker to compare off • The higher the muscle mass the higher the score you will have
Visceral Fat Rating • Visceral fat, also known as abdominal or organ fat, is the fat that is located inside the abdominal cavity, between the organs • It is expressed in terms of its area (cubic centimeters) • A rating between 1-12 indicates you have a healthy level of visceral fat • A rating between 13-59 indicates an excess of visceral fat • Excess visceral fat is associated with type 2 diabetes, insulin resistance and other obesity-related diseases
Degree of Obesity • Degree of obesity denotes the percentage that you are away from the optimal BMI • The optimal BMI is 22 • The healthy BMI range is associated with -16% to +13.2% degree of obesity
Metabolic Age • Metabolic age is a calculation which compares your BMR to the BMR average of your chronological age group • If your metabolic age is lower than your actual age, it suggests that the body is in good health • If your metabolic age is higher than your actual age, it’s an indication that you need to improve your metabolic rate • There is ±15 years buffer to limit the range someone could fall below/above their actual age.
This is where rugby players tend to sit Physique Physique rating assesses muscle score and body fat levels and rates the result as one of nine body types. The current reading is displayed as a turquoise colour, your goal target is purple and previous readings are in blue This is where long distance runners tend to sit
The value in the middle shows your percentage of completion for that specific metric which is also visualised on the wheel Goal Goal allows you to set specific metric goals which are compared and updated every time you have a scan. You can choose from any of the metrics that are measured
Each metric is displayed in a different colour and different metrics can be chosen to compare. Track Track gives you the ability to view your metric results over time. You can select the show goals toggle which will display your goal on the graph to allow you to see how far away you are from hitting it If you hover over a previous scan you will be able to see the exact value of those results
If your result has had a positive change the value will show the change and the colour will be green Snap If your result has had a negative change the value will show the change and the colour will be red Snap shows the pure change in the metric from your first scan to your most recent scan. Like goal you can choose which metrics you want to snap. If your result has stayed the same then value will be 0 and the colour will be purple