Download
1 / 18
200 likes | 355 Vues
Generating fine resolution leaf area index maps for boreal forests of Finland. Janne Heiskanen, Miina Rautiainen, Lauri Korhonen, Matti Mõttus , Pauline Stenberg. Introduction. Leaf area index (LAI)

E N D
Generating fine resolution leaf area index maps for boreal forests of Finland Janne Heiskanen, Miina Rautiainen, Lauri Korhonen, Matti Mõttus, Pauline Stenberg IGARSS 2011, 24–29 July 2011, Vancouver, Canada
Introduction • Leaf area index (LAI) • Key variable in modeling vegetation-atmosphere interactions, particularly carbon and water cycle • One half of the total leaf surface area per unit ground surface area • Several global-scale LAI products, but finer spatial resolution (e.g. Landsat and SPOT) is needed to describe the spatial heterogeneity of LAI • Empirical, vegetation index (VI) based methods are typically used in fine resolution mapping, but more physically-based approach could generalize better in space and time, and between sensors
Objectives • Generate fine-resolution forest LAI maps for Finland using satellite image mosaics at 25 m resolution • LAI estimation methods • Empirical model based on reduced simple ratio (RSR) • Inversion of forest reflectance model (PARAS) • Compare upscaled LAI maps with MODIS LAI (V005)
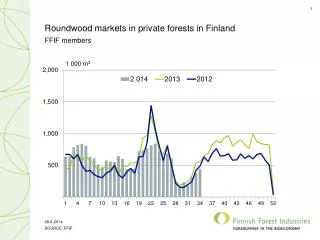
LAI fieldmeasurements > 1000 field plots measured with LAI-2000 PCA or hemispherical photography (2000–2008) SPOT HRVIR and Landsat ETM+ images from the same summer (atmospherically corrected)
RSR-Le regression models • Requires min and max SWIR reflectancefactors • Best modelfitifvaluesaredeterminedseparately for eachscene (scene-specific RSR)instead of general values (global RSR) Le RSR
PARAS forest reflectance model Rautiainen & Stenberg 2005, RSE • θ1 and θ2: view and Sun zenith angles cgf =canopy gap fraction ρground = BRF of the forest background f= canopy upward scattering phase function i0(θ2 ) = canopy interceptance ωL = leaf albedo groundcomponent canopycomponent p p • Photon recollision probability (p): the probability by which a photon scattered from a leaf (or needle) in the canopy will interact within the canopy again p p
PARAS simulations • Can use field measurements of canopy structure and optical properties of foliage and understory • Calculation of p from LAI-2000 PCA data (Stenberg 2007, RSE) • 30,000 simulations for training neural networks • LAI-2000 PCA (cgf, p) • Leaf (needle) albedo from images • Mixtures of forest understory spectra (Lang et al. 2001) • Red, NIR and SWIR DIFN = ‘diffuse non-interceptance’ BRFNIR Empirical data BRFred
Accuracy at an independentvalidationsite Heiskanen et al. 2011, JAG RSR (scene-specific) PARAS RMSE = 0.57 (24.2%) Bias = -0.30 (-12.7%) r = 0.90 RMSE = 0.59 (25.1%) Bias = -0.27 (-11.4%) r = 0.88 EstimatedLe EstimatedLe MeasuredLe MeasuredLe
Satelliteimagemosaics • Country-wide mosaics (IMAGE2000/2006) produced by Finnish Environmental Institute (SYKE) • 37 Landsat ETM+ scenes, 1999–2002 • 83 IRS P6 LISS and SPOT-4 HRVIR scenes, 2005 or 2006 • Input data for Finnish Corine Land Cover databases (CLC2000/2006) • Images have been atmospherically corrected, but red and SWIR reflectance factors were calibrated using satellite data from the field sites
Satelliteimagemosaics(2000/2006) Landcovermaps (2000/2006) RSR Heiskanen et al. 2011, JAG LAI estimationmethods Validation Effective LAI (Le) Fieldplots (6 sites) Correction for shoot-levelclumping LAI MODIS LAI Intercomparison
Scene-specific RSR SWIR BRF Scene-boundaries (2006) Forestmask + +
Scene-specific RSR:ρSWIR_min,ρSWIR_max Global values based on sample plots ρSWIR_min = 0.063 ρSWIR_max = 0.244
Accuracy at modellingsites RSR (scene-specific) RSR (global) PARAS EstimatedLe MeasuredLe
LAI maps(global RSR) 2000 2006
LAI ≤ 1.0 1.1–2.0 • 2.1–3.0 • 3.1–4.0 • 4.1–5.0 • 5.1–6.0 > 6.0 LAI 2006 and MODIS LAI (V005) MODIS LAI (IMAGE2006 dates) MODIS LAI (Julyaverage 2002–2010) LAI 2006 White = non-forest (< 50% forest), Black = clouds Good quality (main algorithm with or without saturation)
Comparisonwith MODIS LAI Scene-wiseaverages • MODIS LAI includesalsounderstory LAI
Conclusions • Empirical and forest reflectance model based methods for estimating LAI • Empiricalmodelbased on RSR (global) wasselected for generating LAI maps for Finnishforests • Realistic LAI patternsbut the highestvaluesareunderestimated • Reflectance data and landcovermaps • Systematicdifference in red and SWIR bands • Phenological differencesbetween the images • Clumpingcorrection • Furthervalidation of MODIS LAI (V005)
Thankyou! Heiskanen, J, M Rautiainen, L Korhonen, M Mõttus & P Stenberg (2011). Retrieval of boreal forest LAI using a forest reflectance model and empirical regressions. International Journal of Applied Earth Observation and Geoinformation 13: 595–606. doi:10.1016/j.jag.2011.03.005 http://www.mm.helsinki.fi/~mxrautia/lai/index.htm