Download
1 / 1
10 likes | 174 Vues
Comparison of Weights in Meta-analysis Under Realistic Conditions Michael T. Brannick Liu-Qin Yang Guy Cafri University of South Florida. Abstract. Study Design. Results. Implications for Meta-analysis Literature.

E N D
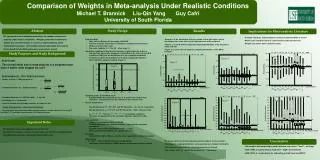
Comparison of Weights in Meta-analysis Under Realistic Conditions Michael T. Brannick Liu-Qin Yang Guy Cafri University of South Florida Abstract Study Design Results Implications for Meta-analysis Literature We compared several weighting procedures for random-effects meta-analysis under realistic conditions. Weighting schemes included unit, sample size, inverse variance in r and in z, empirical Bayes, and a combination procedure. Unit weights worked surprisingly well, and the Hunter and Schmidt (2004) procedures worked best overall. • Provided a database and quantitative summary of published M-As of interest • Monte Carlo simulation based on representative study characteristics • Weights only matter when k and N are small • Published M-As • AMJ, JAP and Personnel Psychology; 1979-2005 • Inclusion criterion: effect sizes (r) available or available after conversion • 48 M-As and 1837 effect sizes • Inter-rater reliability: 1.0 – Ns; .99 – effect sizes (r) • Simulation conditions formed by characteristics of published meta-analyses • Average N (N_bar) and the skewness of N distribution (N_skew) for each M-A • A median of 168.57 for the distribution of N_bar (sampling distribution) • A median of 2.25 for the distribution of N_skew (sampling distribution) • Four conditions along the medians (Figure 1) • Sampling studies for the Monte Carlo • A published M-A was randomly chosen, its K and Ns were used for that simulation. The parameters for the simulations were chosen from: • Choice of parameters • The distribution of | |: 10th, 50th , and 90th percentile = .10, .22, .44, respectively • The distribution of : 10th, 50th, and 90th percentile = .0005, .0128, and .0328 • 3 ( ) by 3 ( ) of parameter conditions • Therefore, the parameters in the simulation represent published studies • Data generation • A Monte Carlo program written in SAS IML • Picked an M-A under one condition of Figure 1, then picked a parameter combination • Sampled r from a normal distribution of that and • Meta-analyzed those sampled r(s); repeated 5000 times • Estimators • H&S (2004) in r, H&V (1998) in z, and the other 4 approaches as described earlier • Data analysis • and were estimated with each of 6 approaches • Root-mean-square-difference (RMSR) between the parameter and the estimate • Skewness in the distribution of Ns was shown to have little effect, and so simulations were rerun with only the high/low levels of N considered • Figures 2, 4, and 6 show the empirical sampling distributions of the population mean estimates • Figure 3, 5, and 7 show the empirical sampling distributions of the REVC estimates • The design elements had their generally expected impacts on the estimates • The empirical sampling distributions were generally more compact with big Ns • The means got larger when the underlying parameters increased • The variance of the distribution increases as increases Study Purposes and Study Background Figure 6 Figure 4 • Study Purpose • The overall effect size in meta-analysis is a weighted mean. Does it matter what weights we use? • Study Background— Other Weighting Schemes • Hedges & Vevea’s (1998) approach in r • Shrunken Estimates in r(Empirical Bayes) • Combined Estimates in r: REVC by H&S; by H&V • Unit Weights in r: The baseline • Hunter & Schmidt use N; Hedges converts to z and uses N-3 • Study Background— Realistic Simulation • This simulation was based on published meta-analyses, so that values of k, N, rho ( ), and REVC ( ) would be representative of I/O meta-analyses. Figure 2 Figure 1 Distributions of sample sizes from published meta-analyses Good estimator Figure 5 Figure 7 Figure 3 Good Estimator Important Notes • Random-effect models were applied in the current study • Sampled actual numbers of studies (K) and sample sizes (N) from the published M-As • Used population parameters representing published M-A data Conclusions • Unit weights had surprisingly good estimates, esp. when and are large • H&V (1998) in z performed as expected— slight overestimates • H&S (2004) in r worked best for estimating overall mean and REVC