Microsoft Business Intelligence Environment Overview
160 likes | 356 Vues
Microsoft Business Intelligence Environment Overview. BI Environment Overview. Business Intelligence Suite consisting of Office 2010, Sharepoint 2010 and SQL Server 2010. Designed to provide easy access to the wealth of information contained in your data.

Microsoft Business Intelligence Environment Overview
E N D
Presentation Transcript
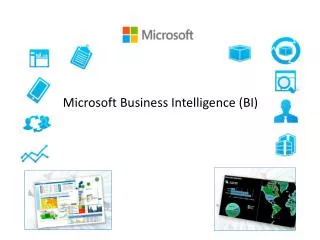
BI Environment Overview • Business Intelligence Suite consisting of Office 2010, Sharepoint 2010 and SQL Server 2010. • Designed to provide easy access to the wealth of information contained in your data. • “Business Intelligence solutions enable IT departments to proactively empower users with self-service capabilities while retaining the ability to monitor, manage, and govern the data and solutions that users create.”
BI Environment Overview • Institutional Analysis and Planning’s (IAP) implementation of the BI Suite • Report User Experience • Demonstration of the reporting environment the user sees and the export functionality • Cube User Experience • Demonstration of the Cube environment • Developer Experience • Construction and Structure of cubes
Report User Experience • What does the end user see? • What are Reports?
Cube User Experience • Accessed through Excel pivot tables • Leverages already existing user experience in Excel • Drill through for detailed comparisons • Excel does not directly access the data, data is provided through Analysis Services.
Cube Demo • How many students are in a specific class? • What was the average grade of the class? • How many students were in housing and were their grades different?
Developer Experiences • Reports • Cubes • Database structure
Report Creation • Database connection (Data Source) • Queries on the Data Source (Datasets) • Tables of data like pivot tables (Tablix) • Charts • Report Parameters • Reuse of created content (Report Parts and Sub-reports)
Cube Creation • Dimensions, Measures, Calculated Measures, KPIs • Relationships between measures and dimensions • How the cube deals with many-to-many joins
Database Structure • Snowflake Schema – Lessons Learned • Fact and Dimension tables • Foreign Key Constraints for Data Integrity
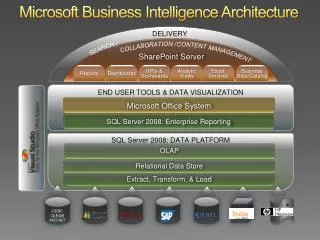
Server Architecture Campus Web and Excel Access SSIS Oracle Server SSAS Shared SQL Server SSRS Web Reporting and Analysis Services