Download
1 / 29
290 likes | 391 Vues
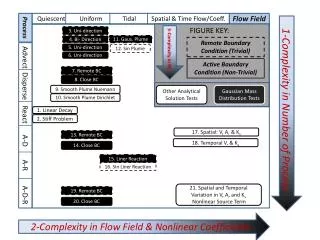
Explore efficient methods for handling wavelet coefficients over edges using nonlinear approximants. Learn about systematic adaptive linear estimators and sparse reconstruction techniques. Find out how to predict erased data in piecewise smooth signal compression scenarios.

E N D
Predicting Wavelet Coefficients Over Edges Using Estimates Based on Nonlinear Approximants Onur G. Guleryuz oguleryuz@erd.epson.com Epson Palo Alto Laboratory Palo Alto, CA google: Onur Guleryuz
Outline: • Background and Problem Statement • Formulation • Algorithm • Results More than what I am doing, it’s how I am doing it. Overview Topic: Wavelet compression of piecewise smooth signals with edges. (piecewise sparse) Benchmark scenario: Erase all high frequency wavelet coefficients Piecewise smooth signal mse? Predict erased data
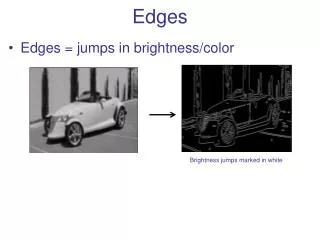
Notes Q: What are edges? (Vague and loose) A: Edges are localized singularities that separate statistically uniform regions of a nonstationary process. • Caveats: • This method is not: • edge/singularity detection, • convex (and therefore not POCS), • solving inverse problems under additive noise (wavelet-vaguelette), • an explicit edge/singularity model. No amount of looking at one side helps predict the other side. • This method is: • a systematic way of constructing adaptive linear estimators, • an adaptive sparse reconstruction, • based on sparse nonlinear approximants (non-convex by design), • a model for non-edges (sparsity/predictable detection).
Too many wavelet coefficients over edges 2-D (Need to reduce) M. N. Do, P. L. Dragotti, R. Shukla, and M. Vetterli, ``On the compression of two-dimensional piecewise smooth functions,'‘ Proc. IEEE Int. Conf. on Image Proc. ICIP ’01, Thessaloniki, Greece, 2001. Wavelet Compression in 1-D and 2-D 1-D Wavelets of compact support achieve sparse decompositions A. Cohen, I. Daubechies, O. G. Guleryuz, and M. T. Orchard, ``On the importance of combining wavelet-based nonlinear approximation with coding strategies,'' IEEE Trans. Info. Theory}, vol. 48, no. 7, pp. 1895-1921, July 2002.
Translation/rotation invariance is an issue. Best linear representations are given by overcomplete transforms. Current Approaches “1”: Modeling higher order dependencies over edges in wavelet domain. • F. Arandiga, A. Cohen, M. Doblas, and B. Matei, ``Edge Adapted Nonlinear Multiscale Transforms for Compact Image Representation ,'‘ Proc. IEEE Int. Conf. Image Proc., Barcelona, Spain, 2003. • H. F. Ates and M. T. Orchard, ``Nonlinear Modeling of Wavelet Coefficients around Edges,'‘ Proc. IEEE Int. Conf. Image Proc., Barcelona, Spain, 2003. … (Reduce by prediction) “2”: New Representations. • J. Starck, E. J. Candes, and D. L. Donoho, ``The Curvelet Transform for Image Denoising,'‘ IEEE Trans. on Image Proc., vol. 11, pp. 670-684, 2002. • M. Wakin, J. Romberg, C. Hyeokho, and R. Baraniuk, ``Rate-distortion optimized image compression using wedgelets,'‘ Proc. IEEE Int. Conf. Image Proc. June 2002. • P.L. Dragotti and M. Vetterli, ``Wavelet footprints: theory, algorithms, and applications,'‘ IEEE Trans. on Sig. Proc., vol. 51, pp. 1306-1323, 2003. … (Don’t create too many)
1 2 M i G G G G Q: What are Overcomplete Transforms? Example: Translation invariant, overcomplete transforms • Spatial DCT tilings of an Image … … image-wide, orthonormal transform Image arranged in a (Nx1) vector x, are (NxN)
image … … 1 2 M G G G Sparse Decompositions and Overcomplete Transforms No single orthonormal transform in the overcomplete set provides a very sparse decomposition. sparse portions nonsparse portions
remove the insignificant coefficients and the noise that they contain … … … 1 M G G Issues with Overcomplete Trfs Compression angle: Thresholding based Denoising: sparse portions nonsparse portions image (x)
Fill missing information with initial values, T=T . 0 Denoise image with hard-threshold T. Enforce available information. T=T-dT DCC’02 http://eeweb.poly.edu/~onur Onur G. Guleryuz, "Nonlinear Approximation Based Image Recovery Using Adaptive Sparse Reconstructions and Iterated Denoising: Part I - Theory“, “Part II – Adaptive Algorithms,” IEEE Transactions on Image Processing, in review.
Nonlinear Approximation and Nonconvex Image Models Assume single transform missing sample available sample Recovery transform coordinates Sample coordinates for a two sample signal Find the missing data to minimize
There is method to the denoise, denoise, …, denoise madness. • No explicit statistical modeling. • Systematic way of generating adaptive linear estimators. • It doesn’t care about the nonsparse portions of transforms (must identify sparse portions correctly) • Sparse predictable. • Relationships to harmonic analysis. Underlying Estimation Method
Modeling “Non-Edges” (Sparse Regions) DCT1 DCT2=shift(DCT1) DCTM=… edge smooth smooth I don’t care how badly the transform I am using does over the edges. I determine non-edges aggressively.
Algorithm Fill missing information (high frequency wavelet coefficients) with initial values (0), T=T . 0 Denoise image with hard-threshold T. Enforce available information (low frequency wavelet coefficients). T=T-dT I use DCTs and a simple but good denoising technique: http://eeweb.poly.edu/~onur Onur G. Guleryuz, ``Weighted Overcomplete Denoising,‘’ Proc. Asilomar Conference on Signals and Systems, Pacific Grove, CA, Nov. 2003.
Test Images Graphics (512x512) Bubbles (512x512) Cross (512x512) Pattern (512x512) I admit, you can do edge detection on this one Teapot (960x1280) Lena (512x512)
Implementation 1: l-level wavelet transform (l=1, l=2) 2: All high frequency coefficients set to zero (l=1 half resolution, l=2 quarter resolution) 3: Predict missing information 4: Report PSNR=10log10(255*255/mse)
Results on Graphics Graphics, l=1 Graphics, l=2 30.48dB to 51dB 27.15dB to 37.44dB
Results on Bubbles Bubbles, l=1 Bubbles, l=2 33.10dB to 35.10dB 29.03dB to 30.14dB
Bubbles crop, l=1 magnitude info. location info Unproc.: 30.41dB Predicted: 33.00dB
Bubbles crop, l=2 Unproc.: 26.92dB Predicted: 28.20dB
Pattern crop, l=1 Holder exponent extrapolation, step edge assumption, edge detection, etc., aren’t going to work well here. still a jump Unproc.: 25.94dB Predicted: 26.63dB
Cross crop, l=1 Holder exponent extrapolation, step edge assumption, edge detection, etc., aren’t going to work well here. Unproc.: 18.52dB Predicted: 18.78dB
PSNR over 3 and 5 pixel neighborhood of edges (l=1) +21 dB +21 dB +4 dB +2 dB +2 dB +0.5 dB +1.5 dB +0 dB
Comments and Conclusion • I will show a few more results. • Around edges, magnitude and location distortions. • Instead of trying to model many different types of edges, model non-edges as sparse (same algorithm handles all varieties). • Early work 1: Interpolation in pixel domain may give misleading PSNR numbers for two reasons. • Early work 2: Hemami’s group and Vetterli’s group have wavelet domain results (based on Holder exponents), but not on same scale. • You can implement this for your own transform/filter bank • (denoise, available info, reduce threshold, …).
Results on Teapot Teapot, l=1 Teapot, l=2 36.17dB to 41.81dB 32.54dB to 35.93dB
Teapot crop, l=1 Unproc.: 28.38dB Predicted: 34.78dB
Teapot crop, l=2 Unproc.: 25.10dB Predicted: ??.??dB
Results on Lena Lena, l=1 Lena, l=2 35.26dB to 35.65dB 29.58dB to 30.04dB
Lena crop, l=1 Unproc.: 34.42dB Predicted: 35.03dB
Lena crop, l=2 Unproc.: 27.79dB Predicted: 29.83dB