Download
1 / 27
270 likes | 390 Vues
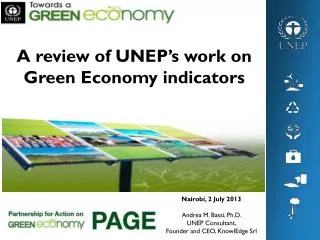
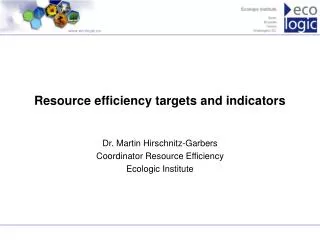
Presentation at informal meeting of Environment Ministers 16 July 2014, Milano. Eurostat's work on resource productivity indicators and green jobs. Walter J. Radermacher Chief Statistician of the European Union.

E N D
Presentation at informal meeting of Environment Ministers 16 July 2014, Milano Eurostat's work on resource productivity indicators and green jobs Walter J. Radermacher Chief Statistician of the European Union
Which cocktail of driving forces is causing pressures on the environment (Population x GDP/capita x Pressures/GDP; the long term interaction between these factors)? How is efficiency (Pressures/GDP) developing (single factor and multi factor productivity, taxation of factors, trading schemes)? How is the status of our environment in its main natural components (resilience, quantitative depletion, qualitative degradation, tipping points of systems)? How far are political and economic responses preventing or treating environmental damages (circular economy, green goods and jobs, environmental expenditure)? How are our activities influencing the environment elsewhere or in the future (footprint of production and consumption, international trade)? Some key questions related to the environment 2 W. J. Radermacher Eurostat
Living well within the limits of our planet 3 W. J. Radermacher Eurostat
Smarter, greener, more inclusive? Indicators to support the Europe 2020 strategy • 5 main themes • 8 headline indicators • 80+ descriptive indicators 4 W. J. Radermacher Eurostat
Main Europe 2020 indicators 2005 –> now in 10 seconds W. J. Radermacher Eurostat
Main Europe 2020 indicators 2005 –> now in 10 seconds W. J. Radermacher Eurostat
Main Europe 2020 indicators 2005 –> now in 10 seconds W. J. Radermacher Eurostat
Main Europe 2020 indicators 2005 –> now in 10 seconds W. J. Radermacher Eurostat
Main Europe 2020 indicators 2005 –> now in 10 seconds W. J. Radermacher Eurostat
Main Europe 2020 indicators 2005 –> now in 10 seconds W. J. Radermacher Eurostat
Main Europe 2020 indicators 2005 –> now in 10 seconds W. J. Radermacher Eurostat
Main Europe 2020 indicators 2005 –> now in 10 seconds W. J. Radermacher Eurostat
Main Europe 2020 indicators 2005 –> now in 10 seconds W. J. Radermacher Eurostat
Resource efficiency scoreboard on Eurostat's website W. J. Radermacher 14 Eurostat
Resource efficiency scoreboard on Eurostat's website A three-tier system based on available statistics from Eurostat, the EEA, the JRC and other international recognised sources for the Europe 2020 Flagship initiative "A resource-efficient Europe" and its roadmap. Lead indicator (Resource productivity = GDP/DMC) (from Eurostat's environmental accounts – Regulation (EU) No 691/2011) Dashboard indicators (land, water, carbon) Sets of thematic indicators • 'Transforming the economy' (waste treatment and recycling, eco-innovation, getting prices right – environmental taxes) • 'Nature and ecosystems' (biodiversity, air, land, marine resources) • 'Key areas' (food, buildings, mobility) Eurostat press release 186/2013 of 6 Dec. 2013: Thirty indicators to measure resource efficiency in the EU W. J. Radermacher 15 Eurostat
Resource productivity (GDP/DMC) latest data (from Eurostat's environmental accounts Regulation (EU) No 691/2011) W. J. Radermacher Eurostat
DMC - shortcomings 17 Domestic Material Consumption (DMC) measures the materials that actually circulate in the economy of a country and that remain in the country as stocks (e.g. in buildings) or end up as waste/emissions. "Asymmetry" from a resource perspective: domestic extraction is raw materials (e.g. gross ore, crude coal etc.) but imports & exports are often goods (e.g. cars, machinery, mobile phones, etc.) -> de-manufacturing can drive down DMC Solution: convert imports and exports into their Raw Material Equivalents (RME) taking into account the entire production chain from the cradle to the border This gives a "footprint-type" indicator = Raw Material Consumption (RMC) W. J. Radermacher Eurostat
RMC – difficulties 18 • RMC cannot be "observed" => various modelling approaches convert trade data into raw material equivalents. • Eurostat uses an extended hybrid single region input-output model to estimate EU totals for RMC. Other models exist. For individual Member States calculations may be less reliable. Comparing some EU totals for RMC: • Eurostat's RMC model: 17,5 t/cap Multiregional global input-output models: • WIOD (7th Framework Programme): 20.6 t/cap • EXIOBASE (6th Framework Programme): 21.2 t/cap • EORA (University of Sidney): 23.4 t/cap W. J. Radermacher Eurostat
DMC and RMC - does it make a difference? RMC a bit higher for most countries (lower for Germany) but trends not very different *…RMC for individual countries not available for all years, ratios partly interpolated 19 W. J. Radermacher Eurostat
Breakdown by material - DMC construction is main driver of RMC 20 W. J. Radermacher Eurostat
Breakdown by material - RMC 21 W. J. Radermacher Eurostat
Policy cycle DMC as lead indicator at EU and Member State level has legal base, RMC estimated at EU level and by few MS currently 22 Problem analysis Identifying appropriate measures Target setting Implementation of measures Monitoring Correction of targets/measures W. J. Radermacher Eurostat
Policy cycle • Problem analysis • Identifying appropriate measures • Target setting • Implementation of measures • Monitoring • Correction of targets/measures full range of accounts: e.g. RMC calculations e.g. material breakdown e.g. industry breakdown(multifactor productivity) e.g. decomposition analyses(driving forces) e.g. linking to IO models e.g. footprint type analyses …not necessarily only official statistics; close cooperation with research 23 W. J. Radermacher Eurostat
Example: industry profiles (shares of different industries for main characteristics, EU 27, 2010) W. J. Radermacher 24 Eurostat
Example: Driving forces of CO2 emissions in NL 25 W. J. Radermacher Eurostat
Example: Environmental employment in EU-28 Source: Eurostat (env_ac_egss1) 26 W. J. Radermacher Eurostat
Thank you for your attention! • Walter.Radermacher@ec.europa.eu • http://ec.europa.eu/eurostat 27 W. J. Radermacher Eurostat