Cancer Classification Using Molecular Gene Expression
Explore molecular gene expression-driven cancer classification methods like k-Nearest Neighbor (KNN) for distinguishing disease classes and predicting cancer types. Discover insights on leukemia types, symptoms, treatment, outcomes, and data analysis techniques.

Cancer Classification Using Molecular Gene Expression
E N D
Presentation Transcript
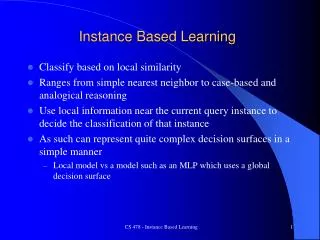
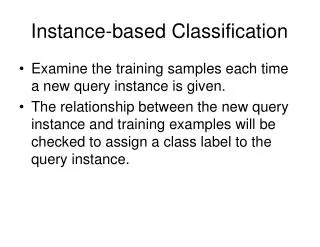
Instance-based Classification • Examine the training samples each time a new query instance is given. • The relationship between the new query instance and training examples will be checked to assign a class label to the query instance.
KNN: k-Nearest Neighbor • A test sample x can be best predicted by determining the most common class label among k training samples to which x is most similar. • Xj—jth training sample, yj—the class label for xj, Nx—the set of k nearest neighbors of x in training set. Estimate the probability x belongs to ith class:
KNN: k-Nearest Neighbor, con’t • Proportion of K nearest neighbors that belong to ith class: • The ith class which maximizes the proportion above will be assigned as the label of x. • Variants of KNN: filtering out irrelevant genes before applying KNN.
Molecular Classification of Cancer Class Discovery and Class Prediction by Gene Expression Monitoring
Publication Info • "Molecular Classification of Cancer: Class Discovery and Class Prediction by Gene Expression Monitoring" • Golub, Slonim, Tamayo, Huard, Gaasenbeek, Mesirov, Coller, Lo, Downing, Caligiuri, Bloomfield, Lander • Appears in Science Volume 286, October 15, 1999 • Whitehead Institute/MIT Center for Genome Research • http://www-genome.wi.mit.edu/cancer • ...and Dana-Farber (Boston), St. Jude (Memphis), Ohio State • ...additional publications by same group shows similar technique applied to different disease modalities.
Cancer Classification Class Discovery: defining previously unrecognized tumor subtypes Class Prediction: assignment of particular tumor samples to already-defined classes • Given bone marrow samples: • Which cancer classes are present among sample? • How many cancer classes? 2, 4? • Given samples are from leukemia patients, what type of leukemia is each sample (AML vs ALL)?
Leukemia: Definitions & Symptoms • Cancer of bone marrow • Myelogenous or lymphocytic, acute or chronic • Acute Myelogenous Leukemia (AML) vs Acute Lymphocytic Leukemia (ALL) • Marrow cannot produce appropriate amount of red and white blood cells • Anemia -> weakness, minor infections; Platlet deficiency -> easy bruising • AML: 10,000 new adult cases per year • ALL: 3,500/2,400 new adult/child cases per year • AML vs. ALL in adults & children
Leukemia: Treatment & expected outcome • Diagnosis via highly specialized laboratory • ALL: 58% survival rate • AML: 14% survival rate • Treatment: chemotherapy, bone marrow transplant • ALL: corticosteroids, vincristine, methotrexate, L-asparaginase • AML: daunorubicin, cytarabine • Correct diagnosis very important for treatment options and expected outcome!!! • Microarray could provide systematic diagnosis option • BUT ONLY ONE TYPE OF DIAGNOSTIC TOOL!!!
Leukemia: Data set • 38 bone marrow samples (27 AML, 11 AML) • 6817 human gene probes
Cancer Class Prediction • Learning Task • Given: Expression profiles of leukemia patients • Compute: A model distinguishing disease classes (e.g., AML vs. ALL patients) from expression data. • Classification Task • Given: Expression profile of a new patient + A learned model (e.g., one computed in a learning task) • Determine: The disease class of the patient (e.g., whether the patient has AML or ALL)
g1,1L g1,nÃclass1 g2,1 L g2,nÃclass2 MOM gm,1L gm,nÃclassm Cancer Class Prediction • n genes measured in m patients Vector for a patient
Cancer Class Prediction Approach • Rank genes by their correlation with class variable (AML/ALL) • Select subset of “informative” genes • Have these genes do a weighted vote to classify a previously unclassified patient. • Test validity of predictors.
Ranking Genes • Rank genes by how predictive they are (individually) of the class… g1,1L g1,nÃclass1 g2,1 L g2,nÃclass2 MOM gm,1L gm,nÃclassm
Ranking Genes • Split the expression values for a given gene g into two pools – one for each class (AML vs. ALL) • Determine their mean m and standard deviation sigma of each pool • Rank genes by correlation metric (separation) P(g, class) = (mALL - mAML)/(sALL + sAML) The mean difference between the classes relative to the SD within the classes.
Neighborhood Analysis Each gene g: V(g) = (e1, e2, …, en), ei: expression level of gene g in ith sample. Idealized pattern: c = (c1, c2, …, cn), ci: 1 or 0 (sample I belongs to class 1 or 2. C* idealized random pattern. Counting the number of genes having various levels of correlation with C, compared with the corresponding distribution obtained for random pattern C*.
Selecting Informative Genes • Select the kALL top ranked genes (highly expressed in ALL) and the kAML bottom ranked genes (highly expressed in AML) P(g, class) = (mALL - mAML)/(sALL + sAML) In Golub’s paper, 25 most positively correlated and 25 most negatively correlated genes are selected.
Determine significant genes 1% significance level means 1% of random neighborhoods contain as many points as observed neighborhood. P(g,c)>0.30 is 709 genes (intersects 1%) Median is ~150 genes (if totally random)
Weighted Voting • Given a new patient to classify, each of the selected genes casts a weighted vote for only one class. • The class that gets the most vote is the prediction.
Weighted Voting • Suppose that x is the expression level measured for gene g in the patient V = P(g,class) X |x – [mALL + mAML]/2| Distance from the measurement to the class boundary -- reflecting the deviation of the expression level in the sample from the average of AML and ALL Weight for gene g – weighting factor reflecting how well the gene is correlated with the class distinction
Prediction • Weighted vote: • VAML=Sviwi|vi is vote for AML where vi=|xi-(mAML+mALL)/2|
Prediction Strength • Can assess the “strength” of a prediction as follows: PS = (Vwinner – Vloser)/(Vwinner+ Vloser) where Vwinner is the summed vote (absolute value) from the winning class, and Vloser is the summed vote (absolute value) for the losing class
Prediction Strength • When classifying new cases, the algorithm ignores those cases where the strength of the prediction is below a threshold… • Prediction = • [ALL, if VALL > VAMLÆ PS > q • [AML, if VAML > VALLÆ PS > q • [No-call, otherwise.
Experiments • Cross validation with the original set of patients • For i = 1 to 38 • Hold the ith sample aside • Use the other 37 samples to determine weights • With this set of weights, make prediction on the ith samples • Testing with another set of 34 patients…
Prediction: Results • "Training set" results were 36/38 with 100% accuracy, 2 unknown via cross-validation (37 train, 1 test) • Independent "test set" consisted of 34 samples • 24 bone marrow samples, 10 peripheral blood samples • NOTE: "training set" was ONLY bone marrow samples • "test set" contained childhood AML samples, different laboratories • Strong predictions (PS=0.77) for 29/34 samples with 100% accuracy • Low prediction strength from questionable laboratory Slection of 8-200 genes gives roughly the same prediction quality.
Cancer Class Discovery • Given • Expression profiles of leukemia patients • Do • Cluster the profiles, leading to discovery of the subclasses of leukemia represented by the set of patients
Cancer Class Discovery Experiment • Cluster the expression profiles of 38 patients in the training set • Using self-organizing maps with a predefined number of clusters (say, k) • Run with k = 2 • Cluster 1 contained 1 AML, 24 ALL • Cluster 2 contained 10 AML, 3 ALL
Cancer Class Discovery Experiment • Run with k = 4 • Cluster 1 contained mostly AML • Cluster 2 contained mostly T-cell ALL • Cluster 3 contained mostly B-cell ALL • Cluster 4 contained mostly B-cell ALL • It is unlikely that the clustering algorithm was able to discover the distinction between T-cell and B-cell ALL cases