Download
1 / 18
180 likes | 291 Vues
This document explores the impact of systematic approaches to achieving excellence on business success in Europe. It examines award-winning companies recognized for their excellence through models like the EFQM Excellence Model, the Malcolm Baldrige Award, and the Deming Prize. Key findings suggest that companies recognized for excellence enjoy superior financial performance, including enhanced share prices, over a five-year period post-award. Through a detailed analysis comparing award winners to their matched counterparts, the evidence strongly supports that investing in excellence pays off for businesses.

E N D
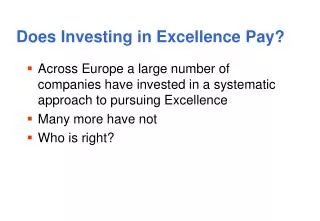
Does Investing in Excellence Pay? • Across Europe a large number of companies have invested in a systematic approach to pursuing Excellence • Many more have not • Who is right?
What is the Evidence? • Systematic Balanced Stakeholder-Inclusive management approaches to deliver business success are in widescale use around the world • Most established are • the Deming Prize Model (Japan since 1950’s) • the Malcolm Baldrige National Quality Award Model (US since 1980’s) • the EFQM Excellence Model (Europe since 1990’s)
What is the Evidence That Pursuing Excellence Pays? • The danger of self-evident truth; the ‘Quality Religion’ • Case Studies or Surveys; reliance on management perception • What is the objective evidence?
The Excellence Strategy Pays! • Vinod Singhal and Kevin Hendricks - US Baldrige study 1990’s (Management Science 1997) • Used publicly available data to compare performance of Excellence Award winners and other companies in their sectors • Found Award winning companies have superior performance on share price and usual financial measures, for up to five years following an award • The perfect investment portfolio!
Methodology • Identify award winners that have effectively implemented the principles of Excellence • Identify the year in which a company received a first award • Collect accounting data for the award winning companies • Identify comparison companies • Collect accounting data for the comparison companies • Calculate the performance differences between each award winner and its comparison company • Trim for Outliers
Key Requirements • Companies need to be publicly traded • Where an award winner is a subsidiary of a publicly listed company, account data is collected on the parent company • Multiple Awards • Selection of Comparison Companies • Outliers
European Study • Data collected 2005-6 • Commissioned by EFQM and BQF • Undertaken by the Excellence Team then at the Centre of Quality Excellence at the University of Leicester • Dr Louise Boulter (Project Leader) – Senior Lecturer Middlesex University Business School • Professor Tony Bendell – Services Ltd./Middlesex University • Ms Hanida Abas – Gloucester University • Prof. Vinod Singhal - Georgia Tec and • Prof. Jens Dahlgaard - Linköping University • Methodology similar to US study
Creating Matched-Pairs of Companies • For each award winning company a comparable company was identified • This is based on the following key criteria: • Same country of incorporation of the parent company • Accounting data available over the same period as for the award winning company • Has at least the same first digit industry code as classified by Datastream • Is closest in size as measured by total assets at the fiscal year end before the award winning company first won an award, with the constraint that the ratio of value of assets is always less than a factor of three
Time Period for Analysis • For the Accounting measures (Assets, Sales, Costs, etc.) we take: • The fiscal year the parent company or any subsidiary first received an award • The five years before the company received the first award • The five years after the company received the first award • For Share Value we take: • The month (21 trading days) during which the parent company or any subsidiaries received a first award • The five years before the company received the first award • The five years after the company received the first award
Overview of Key Performance Measures • Share Value (Buy & Hold returns) – Primary measure • Revenue/Sales measures • Cost measures • Operating income measures • Other accounting based measures
Share Value • Primary measure for the study • Return on shares that an investor would have earned by investing in companies that have effectively implemented the principles of the EFQM Excellence Model • The buy and hold returns for each award winning company has been calculated and compared against buy and hold returns for each comparison company • The returns include capital gains, regular dividends and special dividends, having been already adjusted by Datastream for any stock splits • The aggregate differences give an estimate of the element of share value that corresponds to the effective implementation of the principles of the EFQM Excellence Model
Size of Study • All available European, National and Regional Award winners 1990 - 2004 • Numbers reduced due to requirement to be publicly listed plus match pair requirement • Overall analysis thus based on population of 120 Award winning companies and their Comparison companies • 85 European head-officed companies: 70.8% • 35 Non-European head-officed companies: 29.2%
Share Value Mean Difference of % Change in Share Value between each Award Winning Company and the Comparison Company from one year before to various years after winning the first award 30 Mean Difference of % Change in Buy and hold returns 20 10 0 1 2 3 Year after winning first Award
Award Winners: One Year Before to One Year After Winning • Improvements within a short period of time after having received a first award • Compared to the comparison companies award winners experience further mean increases in performance by an average of: • 8% in sales • 3% in sales over assets • 13% in capital expenditure over assets • 10% in capital expenditure over sales • 12% in assets • 3% in employees • 1.5% reduction in total cost over sales
Award Winners: One Year Before to Three Years After Winning • Compared to the comparison companies award winners experience further mean increases in performance by an average of: • 17% in revenue/sales • 20% in assets • 5% in sales over assets • 1.5% reduction in total cost over sales
Award Winners: One Year Before to Five Years After Winning • Award winners experience even greater increases in growth and cost efficiency measures • Compared to the comparison companies, award winning companies indicate higher performance by an average: • 77% in sales • 18% in operating income • 28% in capital expenditure over assets • 30% in expenditure over sales • 40% in assets • 4.4% reduction in costs over sales
Summary of Findings: • An Excellence strategy appears to pay! • Improvements in Excellence-focussed companies compared to the comparison companies are more about increased/improved sales and assets etc than cost reduction • It’s not just about leanness and process efficiency • Performance over time is complex and varies between companies, markets and countries
CONTACT INFORMATION: Further details of the study & other research can be obtained from: Dr Louise Boulter l Middlesex University Business School Email: l.boulter@mdx.ac.uk