
Uploaded by
kedma
1 SLIDES
87 VUES
10LIKES
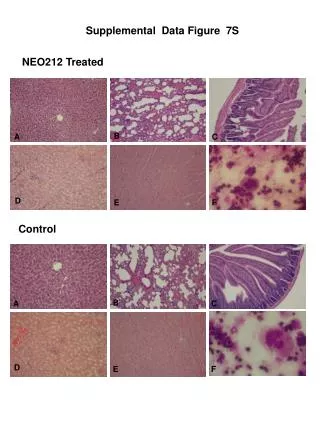
NEO212 Treated Cells Show Enhanced Proliferation in Cancer Control Group
DESCRIPTION
Figure 7S displays supplemental data comparing the proliferation rates of NEO212-treated cells (B, A, C, D, E, F) with those in the control group. The results highlight increased proliferation in cancer cells post-NEO212 treatment.
Download
1 / 1
Download Presentation

Télécharger la présentation
NEO212 Treated Cells Show Enhanced Proliferation in Cancer Control Group
An Image/Link below is provided (as is) to download presentation
Download Policy: Content on the Website is provided to you AS IS for your information and personal use and may not be sold / licensed / shared on other websites without getting consent from its author.
Content is provided to you AS IS for your information and personal use only.
Download presentation by click this link.
While downloading, if for some reason you are not able to download a presentation, the publisher may have deleted the file from their server.
During download, if you can't get a presentation, the file might be deleted by the publisher.
E N D


More Related
Audio
Live Player