CHAPTER 6 Interest Rates
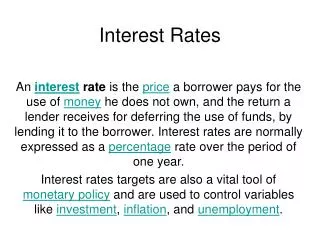
CHAPTER 6 Interest Rates. Determinants of interest rates The term structure and yield curves Investing overseas. Why are these rates different?. 3-month Treasury Bill 5.15% 5-year Treasury Note 4.71% 5-year A Corporate Bond 5.33% 10-year Treasury bond 4.83%

CHAPTER 6 Interest Rates
E N D
Presentation Transcript
CHAPTER 6Interest Rates Determinants of interest rates The term structure and yield curves Investing overseas
Why are these rates different? • 3-month Treasury Bill 5.15% • 5-year Treasury Note 4.71% • 5-year A Corporate Bond 5.33% • 10-year Treasury bond 4.83% • 10-year A Corporate Bond 5.78% • 30-year Treasury bond 4.92%
What four factors affect the level of interest rates? • Production opportunities • Time preferences for consumption • Risk • Expected inflation
“Nominal” vs. “Real” rates r = represents any nominal rate r* = represents the “real” risk-free rate of interest. Like a T-bill rate, if there was no inflation. Typically ranges from 1% to 4% per year. rRF = represents the rate of interest on Treasury securities.
Determinants of interest rates r = r* + IP + DRP + LP + MRP r = required return on a debt security r* = real risk-free rate of interest IP = inflation premium DRP = default risk premium LP = liquidity premium MRP = maturity risk premium
Yield curve and the term structure of interest rates • Term structure – relationship between interest rates (or yields) and maturities. • The yield curve is a graph of the term structure. • The November 2005 Treasury yield curve is shown at the right.
Interest Rate (%) 15 Maturity risk premium 10 Inflation premium 5 Real risk-free rate Years to Maturity 0 1 10 20 Hypothetical yield curve • An upward sloping yield curve. • Upward slope due to an increase in expected inflation and increasing maturity risk premium.
Treasury yield curves vs. corporate bond yield curves • Corporate yield curves are higher than that of Treasury securities, though not necessarily parallel to the Treasury curve. • The spread between corporate and Treasury yield curves widens as the corporate bond rating decreases.
BB-Rated AAA-Rated Illustrating the relationship between corporate and Treasury yield curves Interest Rate (%) 15 10 Treasury Yield Curve 6.0% 5.9% 5 5.2% Years to Maturity 0 0 1 5 10 15 20
Pure Expectations Hypothesis • The PEH contends that the shape of the yield curve depends on investor’s expectations about future interest rates. • If interest rates are expected to increase, L-T rates will be higher than S-T rates, and vice-versa. Thus, the yield curve can slope up, down, or even bow.
Assumptions of the PEH • Assumes that the maturity risk premium for Treasury securities is zero. • Long-term rates are an average of current and future short-term rates. • If PEH is correct, you can use the yield curve to “back out” expected future interest rates.
An example:Observed Treasury rates and the PEH MaturityYield 1 year 6.0% 2 years 6.2% 3 years 6.4% 4 years 6.5% 5 years 6.5% If PEH holds, what does the market expect will be the interest rate on one-year securities, one year from now? Three-year securities, two years from now?
One-year forward rate 6.0% x% 0 1 2 6.2% (1.062)2 = (1.060) (1+x) 1.12784/1.060 = (1+x) 6.4004% = x • PEH says that one-year securities will yield 6.4004%, one year from now. • Notice, if an arithmetic average is used, the answer is still very close. Solve: 6.2% = (6.0% + x)/2, and the result will be 6.4%.
Three-year security, two years from now 6.2% x% 0 1 2 3 4 5 6.5% (1.065)5 = (1.062)2 (1+x)3 1.37009/1.12784 = (1+x)3 6.7005% = x • PEH says that three-year securities will yield 6.7005%, two years from now.
Conclusions about PEH • Some would argue that the MRP ≠ 0, and hence the PEH is incorrect. • Most evidence supports the general view that lenders prefer S-T securities, and view L-T securities as riskier. • Thus, investors demand a premium to persuade them to hold L-T securities (i.e., MRP > 0).
Other factors that influence interest rate levels • Federal reserve policy • Federal budget surplus or deficit • Level of business activity • International factors
Risks associated with investing overseas • Exchange rate risk – If an investment is denominated in a currency other than U.S. dollars, the investment’s value will depend on what happens to exchange rates. • Country risk – Arises from investing or doing business in a particular country and depends on the country’s economic, political, and social environment.
Country risk rankings Source: “Country Ratings by Region,” Institutional Investor, www.institutionalinvestor.com, September 2004.