Modeling Uncertainty
Modeling Uncertainty. Lonnie Chrisman, Ph.D. Lumina Decision Systems Analytica User Group Webinar Series Session 1: 29 April 2010. Today’s Outline. What is uncertainty? Types & sources of uncertainty. Probability a language of uncertainty Interpretation of probabilities

Modeling Uncertainty
E N D
Presentation Transcript
Modeling Uncertainty Lonnie Chrisman, Ph.D.Lumina Decision SystemsAnalytica User Group Webinar SeriesSession 1: 29 April 2010
Today’s Outline • What is uncertainty? • Types & sources of uncertainty. • Probability • a language of uncertainty • Interpretation of probabilities • Why represent uncertainty Up to 4 Analytica exercises…
Course Syllabus(tentative) Over the coming weeks: • Probability Distributions • Monte Carlo Sampling • Measures of Risk and Utility • Common parametric distributions • Assessment of Uncertainty • Risk analysis for portfolios • Decision making, risk management • Hypothesis testing
This is not Statistics 1A!! • Classical statistics: Analyzing significance of your results. Model is immutable once identified. Much attention to heuristics to avoid hard computations. • Modeling Uncertainty: Learning to think more clearly, a process of progressive model refinement to attain greater clarity. Computer does the heavy lifting. “If Computers [Analytica] had been invented before Statistics, Statistics would not have been invented” [Peter Glynn(?)]
What is Uncertainty? • Uncertainty: the lack of perfect and complete knowledge. • Applies to: • Future outcomes • Existing states or quantities • Physical measurements • Unknowable (quantum mechanics) • Exercise: State something that you have perfect and complete knowledge of.
Related Concepts • Randomness • Will by next coin toss be heads or tails? • Variation • 75% of the people in this room have type A blood. • Vagueness • How many people worldwide live in warm climates? • Risk • You could die during the operation. • Statistical Confidence/Significance • The study confirmed the hypothesis at a 95% confidence level.
Probability: A language for uncertainty Probability: A measure for how certain, on a scale from 0 to 1, a statement is to be true. • P(A)=0 : Assertion A is certainly false. • P(A)=1 : Assertion A is certainly true. • P(A)=0.5: Equally likely to true or false. • P(A)=0.7: A is more likely true than false.
What is the Probability that… • A Republican will be U.S. President on Jan 21, 2013? • The Eiffel tower is more than 1000 ft. (305m) tall? • N2 is the most abundant molecule in the Earth’s atmosphere? • Pluto is further from the sun than Neptune (on 29 Apr 2010)? • The share price of Google (GOOG) is more than $60/share as of 10:30am 29 Apr 2010 PDT?
Assertions must be Crisp and Unambiguous Probability of what? • Must be a true/false assertion. • Vagueness not allowed. ✘ “Gas prices will increase substantially in the short term.” ✔ “The average retail price for regular unleaded gas in the state California, as reported by the U.S. Energy Information Administration, will increase by more than 20% from 26 Apr 2010 to 30 Aug 2010.” • Truth theoretically knowable
Clarity (aka Clairvoyant) Test When specifying an assertion, we cannot realistically nail down every detail. • You fail the clarity test when: • two knowledgeable people who set out to learn the truth could conceivably come back with two disagreeing, but legitimate, answers. • The clairvoyant: • Knows everything about the present and past state of world, and can foretell the future of the physical world, but: • Cannot rob the questioner of free will • Cannot make value judgments. • Can answer any question provided it is well-defined and unambiguous.
Boolean Chance Variablesin Analytica • Characterized by a single probability – P(B=true). • Examples: • Component fails • Dow drops by >1000 points • Civil war breaks out in Nigeria • Subject is male • Use Chance variable defined as • Bernoulli(p)
Analytica Exercise Alice has been accepted to Princeton ($45K/yr tuition) and SJSU ($4K/yr tuition). She has applied for a $25K/yr scholarship to Princeton, where she hope to attend, but can only afford $30K per year max. She has a 40% chance of winning the scholarship. Build a model to compute the annual tuition she’ll pay. View the probability distribution and the Mean (expected) values.
Exercise 2 Alice applies for a second $20K scholarship, which she has a 20% chance of winning (independent of the first). If she gets either, or both, she’ll attend Princeton. Augment the model to reflect the impact of both scholarships.
Interpreting Probabilities • Bob says: P(rain tomorrow)=40%Cal says: P(rain tomorrow)=60% • Who is right? • P(speed of sound in air > 700mph)=30% • It either is or isn’t. So does this probability make sense?
“Subjective” Interpretation of Probability • Probabilities measure: • how much what we know. • not frequency of occurrence. • Calibration: • Over many probability assessments, the frequency of true assertions should match our subjective probabilities for the assertions.
End of Session 1 • Slides after this point are clues as to what will be in session 2. • Peek at the exercises, try them in advance!
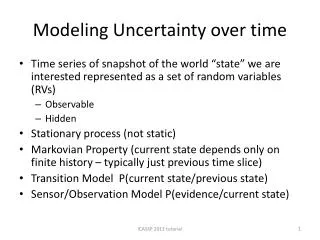
Probability Distributions:Topic for next session… • Most variables in models are real-valued quantities.Examples: • Revenue • Infection rate • Oil well capacity • Megawatt Power output • Unit sales • Saying “Probability of x”, or P(x), is non-sensical. • Saying “Probability that x<15” makes sense.
Why model uncertainty explicitly? As opposed to just basing computations on using the expected value for uncertainty quantities… • Misleading results otherwise… “Flaw of averages” • Explicit “precision” of results. • Some decisions are about uncertainty. E.g., • to gather more information • contingency planning • Improved combining of information sources. • Productivity: Probabilities & distributions can often be estimated more quickly than expected values (!) • Sensitivity analyses • Causal modeling & abduction (diagnostic reasoning)
Flaw of Averages Exercise A toy company must decide how many toys to manufacture for the Christmas season three months in advance. Estimate demand is: Normal(1M,250K) It costs $5 to manufacture a toy, and the company makes a $10 profit on each toy actually sold. If they order 1M toys, what is their expected profit? Compare to result ignoring uncertainty (demand=1M)
Another Exercise An mining company obtains rights to extract a gold deposit during a one-week window next year, before a construction project starts on the sight. Extracting the deposit will cost $900K. The size of the deposit: LogNormal(1K,300) oz. The price of gold next year: LogNormal($1K,stddev:$500) What is the expected value of these mining rights? Compare to result ignoring uncertainty.