Microarray Comparative Genome Hybridization Profile of Chromosome 5: Loss and Gain of Genetic Material
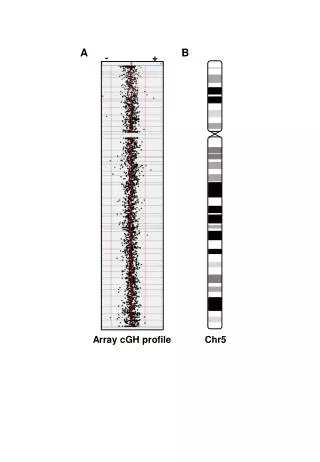
This study presents the comparative genome hybridization profile for Chromosome 5 derived from specimen P1, depicted in Supplementary Figure 2. The profile illustrates signal positions indicating loss of genetic material, marked by (-), and potential gains, indicated by (+). An ideogram of Chromosome 5 is also provided for reference, helping to visualize alterations in genetic content. This analysis is crucial for understanding chromosomal abnormalities and their implications in genetic diseases.

Microarray Comparative Genome Hybridization Profile of Chromosome 5: Loss and Gain of Genetic Material
E N D
Presentation Transcript
A B - + Array cGH profile Chr5
Supplementary Figure 2. Microarray comparative genome hybridisation profile of Chr5 from P1 (A). The expected position of signal from any loss of genetic material in the profile is indicated by (-) and potential gain of material is indicated by (+). A Chr 5 ideogram (B) is shown for comparison.