Download
1 / 26
260 likes | 409 Vues
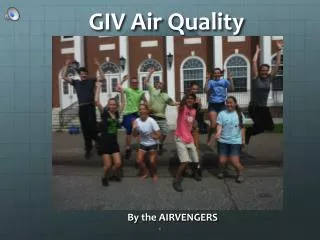
GIV Air Q uality. By the AIRVENGERS. Introduction Research Question and Hypothesis. We monitored PM 2.5 in Burlington and Underhill

E N D
GIV Air Quality By the AIRVENGERS
IntroductionResearch Question and Hypothesis • We monitored PM 2.5 in Burlington and Underhill • PM 2.5 is particulate matter which have a diameter of 2.5 microns or less. Particulate matter is particles in the air, commonly attached to water which contribute to haze and pollution. PM 2.5 is very small and when breathed in it can get into the lungs, causing inflammation. • Research question: How do PM 2.5 levels compare from downtown Burlington, to North Beach, to Underhill, to the industrial sites we visited, to Centennial Woods? • Hypothesis: PM 2.5 levels will be the highest in Burlington, high at industrial places, and North Beach, and lower in Centennial Woods and lowest in Underhill.
Where Does PM 2.5 Come From? • Sources of PM 2.5 include diesel trucks, uncontrolled fires/smoke, smokers, BBQs, wood stoves and humidity/haze. • On Tuesday we noticed a lot of haze. With further research, we found that this was due to smoke coming from wildfires in Canada and the western U.S.
Health Effects • Having lots of particulate matter in the air can not only cause haze and decrease visibility but it can have other effects, especially on human health. It can worsen heart and lung disease, increase the amount of nonfatal heart attacks, aggravate asthma, and increase coughing and difficulty breathing.
Why we did it • Air quality is a huge issue throughout the world. Though much has been done, there is lots we need to still do.
MethodsData Collection • Walked and/or drove to these different locations to measure PM 2.5 with an optical sensor. • Scattered light is measured by optics and a photo detector in the monitor. The intensity of the light is used to determine the amount of particulate matter in the air. • Used a GPS and field notebook to mark our route and location.
How We Monitored PM2.5 • We monitored the air quality in different parts of Burlington and Underhill. We did this by measuring the PM 2.5 in the air, using the Sidepak Personal Aerosol Monitor. • The monitor was in a backpack as we walked around Burlington and Underhill. Air was sampled through a tube.
Our first point, in front of the dorms, our third point at the designated smoking area, our fourth point on Pearl Street.
ResultsUnderhill, June 25th • We went to the Proctor Maple Research Center and the Air Monitor Station in Underhill.
Centennial Woods • We went to Centennial Woods to test how the PM 2.5 levels are in the woods near a city. Centennial Woods Heading into Centennial Woods for the second time to collect data. We crossed swamps, rivers, lakes, oceans and battled through waves and waves of mosquitoes and other dangerous man-eating wild life.
Results, Thursday June 27 54 Minutes
J C McNeil We visited J. C. McNeil Generating Station. It provided electricity for the Burlington area by burning wood. It is the top contributor of PM 2.5 in Chittenden County. PM 2.5 at J. C. McNeil 22 Minutes
CSWD MRF, June 26 We visited the CSWD MRF, Chittenden Solid Waste District Material Recovery Facility. This is where all the recycling goes to be sorted.
Main Burlington Sewage Treatment Plant, June 26 We visited the Sewage Treatment Plant which is located on Lake Champlain. PM 2.5 Levels, Sewage Treatment Plant 6 Minutes
North Beach, June 26 We also visited North Beach. While there, we noticed many people had fires going. PM 2.5 Levels, North Beach 9 Minutes
Comprehensive Averaged Data Comparative PM 2.5
PM 2.5 (24-hour average) Data PM 2.5, Burlington and Underhill
SEM Information SEM stands for, Scanning Electron Microscope. On Thursday the 27th we got to use a SEM. They function by sending electron beams down at the sample. Those beams knock electrons, and even atoms off the sample, which are then measured. The information collected is used to form images.