Top Quark Pair Production: Precision at Fermilab Symposium
10 likes | 124 Vues
Summary of top quark studies at Fermilab, methods of measurement, analysis of decay channels, and projected precision. Rediscovery and analyses in various decay channels reveal good agreement with theoretical expectations.

Top Quark Pair Production: Precision at Fermilab Symposium
E N D
Presentation Transcript
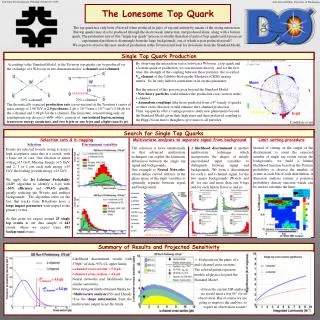
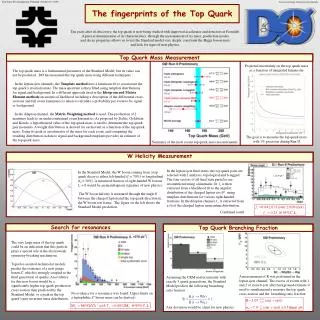
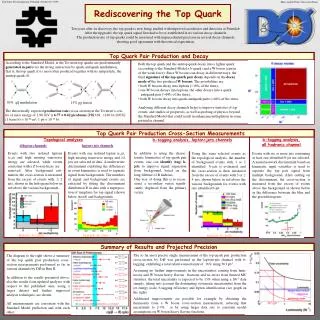
Top Turns Ten Symposium, Fermilab, October 21st 2005 Marc-André Pleier, Universität Bonn Summary of Results and Projected Precision Top Quark Pair Production and Decay Top Quark Pair Production Cross-Section Measurements dca cut@ 0.9 363 pb-1 Ten years after its discovery, the top quark is now being studied with improved accelerator and detectors at Fermilab. After the upgrades, the top quark signal first had to be re-established in its various decay channels. The production rate of top quarks could be measured with unprecedented precision in several decay channels, showing good agreement with theoretical expectation. Rediscovering the Top Quark According to the Standard Model, at the Tevatron top quarks are predominantly generated in pairs via the strong interaction by quark-antiquark annihilation, that is, the top quark (t) is most often produced together with its antiparticle, the antitop quark (t): • Both the top quark and the antitop quark decay into a lighter quark (according to the Standard Model a b-quark) and a W boson (carrier of the weak force). Since W bosons can decay in different ways, the final signature of the top quark pair decay depends on the decay mode of the two produced W bosons. The possibilities are: • both W bosons decay into leptons (≈10% of the time), • one W boson decays into leptons, the other decays into a quark- antiquark pair (≈44% of the time), • both W bosons decay into quark-antiquark pairs (≈46% of the time). • Analysing different decay channels helps to improve statistics of top events, and studies of properties, as well as probing of physics beyond • the Standard Model that could result in enhancement/depletion in some particular channel. 85% qq annihilation 15% gg fusion The theoretically expected production rate (cross-section) at the Tevatron’s cen-tre of mass energy of 1.96 TeV is 6.77 ± 0.42 picobarns [PRD 68, 114014 (2003)](1 barn (b) = 10-28 m2, 1 pb = 10-12 b). b-tagging analysis, all hadronic channel Topological analyses b-tagging analysis, lepton+jets channels dilepton channels lepton+jets channels Events with two isolated leptons (e,m) and high missing transverse energy are selected, while events consistent with a Z boson decay are removed. After background esti-mation, the cross-section is measured from the excess of events with 2 jets, shown in the histogram below in red above the various backgrounds. In addition to using the charac-teristic kinematics of top quark pair events, one can identify (tag) b-jets to improve signal separation from background, based on the long lifetime of B hadrons. One way of doing this is to recon-struct a secondary vertex signifi-cantly displaced from the primary vertex. Events with one isolated lepton (e,m), high missing transverse energy and 4 jets are selected in data. A multivariate discriminant exploiting the differences in event kinematics is used to separate signal from backgrounds. The numbers of signal and background events are extracted by fitting the discriminant distribution D in data with a superposi-tion of templates for top signal (shown below in red) and backgrounds. Using the same selected events as the topological analysis, the number of background events with 1 or 2 identified b-jets is evaluated, and the cross-section is then measured from the excess of events with 3 or 4 jets, shown below in red above the various backgrounds for events with one identified b-jet. Events with six or more jets containing at least one identified b-jet are selected. A neural network discriminant based on kinematic input variables is used to separate the top pair signal from multijet background. After cutting on the discriminant, the cross-section is measured from the excess of events above the background as shown below as the difference between the blue and the green histogram. PLB 626, 45 (2005) PLB 626, 55 (2005) PLB 626, 35 (2005) The so far most precise single measurement of the top quark pair production cross-section by DØ was performed in the lepton+jets channel with b-tagging, exhibiting a total relative uncertainty of 16% using 363 pb-1. Assuming no further improvements in the uncertainties coming from lumi-nosity and W boson heavy flavour fractions and no errors from limited MC statistics, the total uncertainty is expected to be 13% when using a 1fb-1 data sample, taking into account the dominating systematic uncertainties from the jet energy scale, b-tagging efficiency and lepton identification (see graph on the right). Additional improvements are possible for example by obtaining the luminosity from a W boson cross-section measurement, reducing that uncertainty to 2-3%, or by using larger data sets to constrain model assumptions on W boson heavy flavour fractions. The diagram to the right shows a summary of the top quark pair production cross-section measurements performed so far in various channels by DØ in Run II. In addition to the results presented above, also the results from updated analyses with respect to the published ones, using a larger dataset and further improved analysis techniques, are shown. All measurements are consistent with the Standard Model prediction and with each other.