Download
1 / 71
720 likes | 867 Vues
Learning and Tuning of Neurons in Inferior Temporal Cortex. Learning and Neural Plasticity in the Adult Visual System Society for Neuroscience San Diego, California. Bharathi Jagadeesh Department of Physiology & Biophysics University of Washington Seattle, Washington. Macaque temporal lobe. PG.

E N D
Learning and Tuning of Neurons in Inferior Temporal Cortex Learning and Neural Plasticity in the Adult Visual SystemSociety for NeuroscienceSan Diego, California Bharathi JagadeeshDepartment of Physiology & BiophysicsUniversity of WashingtonSeattle, Washington
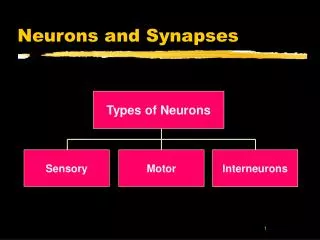
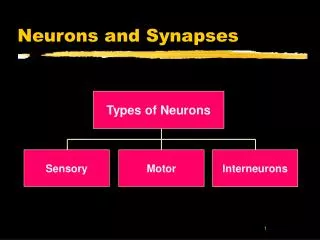
Macaque temporal lobe PG PF V1 TE Ventral or “What” processing stream V3 V1 V2 V4 TEO TE
best next best 100 s/s 300 ms worst
IT Perceptual similarity V1 V2 V4 TEO IT response
Perceptual similarity • Image characteristics • Experience
Similarity of stimuli should explain selectivity in IT cortex Perceptual similarity Proposed relationship Neural responses in IT
Perceptual similarity Proposed relationship Neural responses in IT Measuring perceptual similarity Perceptual similarity algorithms
Image similarity algorithms SIMPlicity algorithm Wang et al (2001) Image divided into 4x4 pixel blocks, feature vector is calculated for each block. Feature vector 6-dimensional: Color dimensions, (LUV space, 3 dimensions) , Spatial frequency, wavelet analysis on the L component of the image (3 dimensions) Number of regions using a k-means algorithm. The similarity between two images computed by comparing regions using Integrated Region Matching (IRM). The SIMPLIcity (similarity) distance is weighted sum of similarity between regions.
32.1 54.9 25.8 32.2 40.9 47.5 38.4 31.2 59.9 33.5 30.0 57.9 Calculate image distances between images
Prediction Perceptual similarity ? Proposed relationship Perceptual similarity algorithms Neural responses in IT
3.54 4.07 4.07 4.34 4.92 5.13 5.24 5.56 5.72 5.90 5.93 6.05 6.39 6.42 6.49 7.00 7.12 7.33 7.34 7.49 7.50 7.50 7.51
SIMPlicity retrieves targets SIMPLIcity 1.00 0.75 0.5 Precision 0.25 50 100 150 200 Number of Relevant Images Retrieved
Algorithms predict perceptual similarity Perceptual similarity Proposed relationship Perceptual similarity algorithms ? Neural responses in IT
Do perceptual similarity algorithms explain neural responses in IT cortex?
best next best 100 s/s 300 ms worst
Example cell: image distance between best/next and best/worst 45 best best 30 SIMPLIcity next best worst 15 0 best-next best best-worst
next best 100 50 0 0 50 100 Population: Distance between Best-worst v. Best-Next Best best 50 40 worst 30 SIMPLIcity ( best and worst stimuli) best-next best-worst best SIMPLIcity (best and next best stimuli)
Do other similarity algorithms explain neural responses in IT cortex?
1.00 0.75 0.50 Precision 0.25 50 100 150 200 Number of Relevant Images Retrieved Contrast: Doesn’t retrieve targets
next best 0.6 0.4 0.2 0.0 0.0 0.2 0.4 0.6 And, doesn’t explain IT responses best 0.2 0.1 worst RMS contrast difference (best and worst stimuli) 0 best-next best-worst best RMS contrast difference (best and next best stimuli)
1.00 0.75 0.50 Precision 0.25 50 100 150 200 Number of Relevant Images Retrieved EMD, another similarity metric: Retrieves targets
next best 100 80 60 40 20 0 0 50 100 And, also explains IT responses 40 30 20 (best and worst stimuli) EMD best-next best-worst best EMD (best and next best stimuli)
Prediction Behavior Perceptual similarity ? Proposed relationship Perceptual similarity algorithms Neural responses in IT
Delayed match to sample (DMS) (easy pair) Fixation 250-500ms Stimulus 16-512ms Mask 256 ms Delay 100-500ms Delay 500-1200ms Response
DMS (difficult pair) Fixation 250-500ms Stimulus 16-512ms Mask 256 ms Delay 100-500ms Delay 500-1200ms Response
Measure “perceptual similarity” High performance Low performance 96% 71% Performance @ 50 ms stimulus presentation
Measure neural selectivity High performance Low performance 96% 71% Performance @ 50 ms stimulus presentation 86% 62% Average neural response difference in passive fixation task
Neural performance v Behavior 1 r = 0.57 0.9 Neural ROC 0.8 0.7 0.6 0.6 0.7 0.8 0.9 1 Behavioral performance
Prediction Perceptual similarity Perceptual similarity algorithms Neural responses in IT
Individual correlations 0.6 0.4 Correlation r 0.2 0 Behavior v neuron Algorithmv neuron
Prediction Perceptual similarity Perceptual similarity algorithms Neural responses in IT
Partial correlations 0.6 0.4 Partial correlation r 0.2 0 Behavior v neuron Algorithm v neuron
Perceptual similarity correlated with IT neuron response similarity Perceptual similarity Perceptual similarity algorithms Neural responses in IT
Passive Association Task Fixation Predictor Delay Choice Bar release Go No Go Erickson CA, Desimone R (1999)
Valid Association Trials Go Trials No Go Trials Predictor Choice Predictor Choice Go 359 ms No Go Go377 ms No Go Go376 ms No Go Go369 ms No Go
Invalid Association Trials Go Trials No Go Trials Predictor Target Predictor Target Go 359/473 ms No Go Go377/465 ms No Go Go376/436 ms No Go Go369/363 ms No Go
Response to choice stimulus is correlated with response to predictor Neural response to choice Erickson & Desimone (1999) Neural response to predictor
Dissimilar stimuli produce similar responses Erickson & Desimone (1999)
43 43 41 41 Image distance Image distance 39 39 37 37 35 35 Similar responses Different responses Similar Responses Different responses Passive fixation: No training Association task: Training Training breaks relationship to algorithm Data from Erickson & Desimone (1999)
Specific conclusions • Perceptual similarity algorithms measure (at least partially) the perceptual similarity of stimuli. • The same algorithms explain (at least partially) the neural response similarity in IT. • But, neural response similarity is better correlated with discrimination performance (measured perceptual similarity) than it is with the image similarity algorithms. • And, training that modifies the processing of stimuli breaks the relationship between image similarity and neural response similarity.
Jagadeesh labUniversity of Washington Katie AhlSarah AllredYan Liu, M.D., Ph.D.Jen Skiver ThompsonAndrew Derrington, Ph.D.Cynthia Erickson, Ph.D.J.M.Jagadeesh, Ph.D.Amanda Parker, Ph.D. Jamie BullisRebecca MeaseAmber McAlister Current members Visiting scholars and collaborators Rotation students & former members
Methods Record from single neurons in the non-human primate brain, while the primate performs visual tasks. Monitor eye movements so that visual stimulus at the retina is known. In my lab, we record from inferotemporal cortex in the macaque, and are of cortex thought to be important for perception of people places and things.