Download
1 / 31
310 likes | 463 Vues
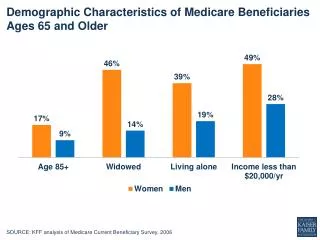
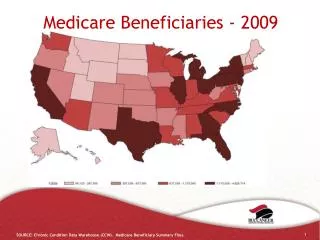
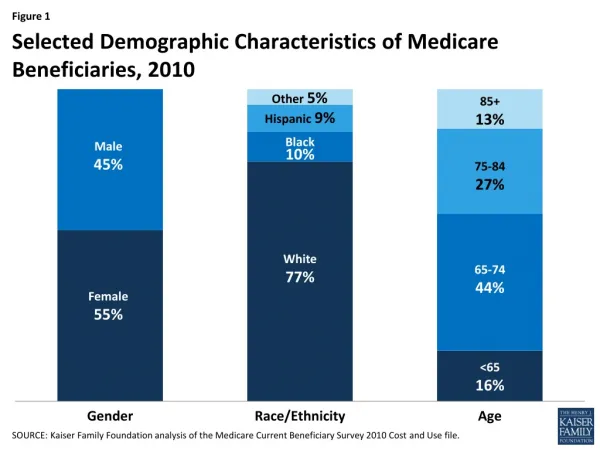
Selected Demographic Characteristics of Medicare Beneficiaries, 2010. Other 5%. 85+ 13%. Hispanic 9%. Black 10%. Male 45%. 75-84 27%. White 77%. 65-74 44%. Female 55%. <65 16%.

E N D
Selected Demographic Characteristics of Medicare Beneficiaries, 2010 Other 5% 85+ 13% Hispanic 9% Black 10% Male 45% 75-84 27% White 77% 65-74 44% Female 55% <65 16% SOURCE: Kaiser Family Foundation analysis of the Medicare Current Beneficiary Survey 2010 Cost and Use file.
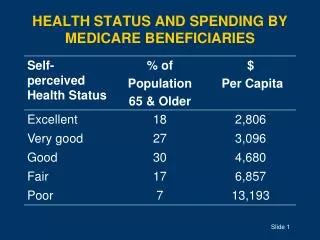
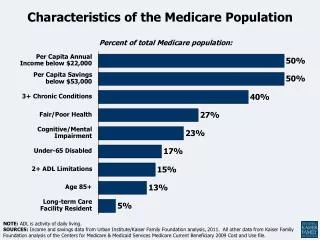
Selected Measures of Health Status of the Medicare Population, 2010 Percent of all Medicare beneficiaries: NOTE: ADL is activity of daily living. SOURCE: Kaiser Family Foundation analysis of the Medicare Current Beneficiary Survey 2010 Cost and Use file.
Distribution of Medicare Beneficiaries By Income, 2013 5%: incomes above $93,900 50%: incomes below $23,500 25%: incomes below $14,400 NOTE: Total household income for couples is split equally between husbands and wives to estimate income for married beneficiaries. SOURCE: Urban Institute analysis of DYNASIM for the Kaiser Family Foundation.
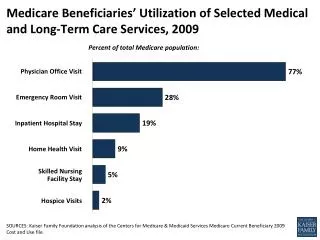
Medicare Beneficiaries’ Utilization of Selected Medicare-Covered Services, 2010 Percent of Traditional Medicare population with: NOTE: Analysis excludes beneficiaries enrolled in Medicare Advantage. SOURCES: Kaiser Family Foundation analysis of the Medicare Current Beneficiary Survey 2010 Cost and Use file.
Distribution of Average Household Spending by Medicare and Non-Medicare Households, 2012 Medicare Household Spending Non-Medicare Household Spending Transportation Transportation Health Care Average Household Spending, 2012 = $33,993* Average Household Spending, 2012 = $53,000 NOTE: *Estimate statistically significantly different from the non-Medicare household estimate at the 95 percent confidence level. SOURCE: Kaiser Family Foundation analysis of the Bureau of Labor Statistics Consumer Expenditure Survey Interview and Expense Files, 2012.
Distribution of Average Total Out-of-Pocket Spending on Services and Premiums by Medicare Beneficiaries, 2010 Long-term care facility Medical providers and supplies Services Premiums Prescription drugs Dental Inpatient hospital Skilled nursing facility Outpatient hospital Home health Average Total Out-of-Pocket Spending on Services and Premiums, 2010: $4,745 NOTE: Analysis excludes beneficiaries enrolled in Medicare Advantage plans. Premiums includes Medicare Parts A and B and other types of health insurance beneficiaries may have (Medigap, employer-sponsored insurance, and other public and private sources). Estimates do not sum to total due to rounding. SOURCE: Kaiser Family Foundation analysis of the Medicare Current Beneficiary Survey 2010 Cost and Use file.
Medicare Beneficiaries’ Average Total Out-of-Pocket Spending on Services and Premiums, by Self-Reported Health Status and Age, 2010 Health status Age NOTE: Analysis excludes beneficiaries enrolled in Medicare Advantage plans. Premiums includes Medicare Parts A and B and other types of health insurance beneficiaries may have (Medigap, employer-sponsored insurance, and other public and private sources).SOURCE: Kaiser Family Foundation analysis of the Medicare Current Beneficiary Survey 2010 Cost and Use file.
Standard Medicare Prescription Drug Benefit, 2015 CATASTROPHIC COVERAGE CatastrophicCoverage Limit = $7,062 in Estimated Total Drug Costs* Plan pays 15%; Medicare pays 80% Enrolleepays 5% Brand-name drugsEnrollee pays 45%Plan pays 5%50% manufacturer discount Generic drugs Enrollee pays 65%Plan pays 35% COVERAGE GAP (“Doughnut Hole”) Initial Coverage Limit = $2,960 in Total Drug Costs Enrollee pays 25% INITIAL COVERAGE PERIOD Plan pays 75% Deductible = $320 DEDUCTIBLE Enrollee pays 100% NOTE: *Amount corresponds to the estimated catastrophic coverage limit for non-low-income subsidy enrollees ($6,680 for LIS enrollees), which corresponds to True Out-of-Pocket (TrOOP) spending of $4,700 (the amount used to determine when an enrollee reaches the catastrophic coverage threshold.SOURCE: Kaiser Family Foundation illustration of standard Medicare drug benefit for 2015 (standard benefit parameter update from Centers for Medicare & Medicaid Services, 2014). Amounts rounded to nearest dollar.
Distribution of Sources of Prescription Drug Coverage Among Medicare Beneficiaries, 2014 5% Total Medicare Enrollment, 2014 = 54.0 millionTotal Part D Enrollment (excluding employer plans), 2014 = 38.1 million NOTE: LIS is low-income subsidy. Total Part D and Medicare enrollment based on 2014 intermediate estimates. Part D non-LIS enrollment includes enrollees in employer/group waiver plans (6.8 million in 2014). SOURCE: Kaiser Family Foundation analysis of data from the 2014 Annual Report of the Boards of Trustees of the Federal Hospital Insurance and Federal Supplementary Medical Insurance Trust Funds.
Medicare Private Plan Enrollment, 1999-2014 In millions: NOTE: Includes MSAs, cost plans, demonstration plans, and Special Needs Plans as well as other Medicare Advantage plans. SOURCE: MPR/Kaiser Family Foundation analysis of CMS Medicare Advantage enrollment files, 2008-2014, and MPR, “Tracking Medicare Health and Prescription Drug Plans Monthly Report,” 1999-2007; enrollment numbers from March of the respective year, with the exception of 2006, which is from April.
Share of Medicare Beneficiaries Enrolled in Medicare Advantage Plans by State, 2014 NOTE: Includes MSAs, cost plans and demonstrations. Includes Special Needs Plans as well as other Medicare Advantage plans. SOURCE: MPR/Kaiser Family Foundation analysis of CMS State/County Market Penetration Files, 2014.
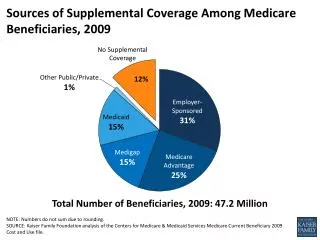
Distribution of Sources of Supplemental Coverage Among Medicare Beneficiaries, 2010 Medigap only Employer-sponsored + Medigap No supplemental coverage Other coverage/ combinations Employer-sponsored only Medicaid only Medicare Advantage + Medicaid Medicare Advantage + Employer-sponsored Medicare Advantage only Total Medicare Beneficiaries, 2010 = 48.4 Million SOURCE: Kaiser Family Foundation analysis of the Medicare Current Beneficiary Survey 2010 Cost and Use file.
Percent of Large Firms (200+ Workers) Offering Retiree Health Benefits to Active Workers, 1988-2014 NOTE: Tests found no statistical difference from estimate for the previous year shown (p<.05). No statistical tests are conducted for years prior to 1999. SOURCE: Kaiser/HRET Survey of Employer-Sponsored Health Benefits, 1999-2014; KPMG Survey of Employer-Sponsored Health Benefits, 1991, 1993, 1995, 1998; The Health Insurance Association of America (HIAA), 1988.
Number of Beneficiaries Enrolled in Medicare, Medicaid, and Both Programs, 2010 Dually eligible 10 million Medicare 40 million Medicaid 56 million Total Medicare beneficiaries, 2010: 50 million Total Medicaid beneficiaries, 2010: 66 million SOURCE: Kaiser Family Foundation analysis of a 5 percent sample of Medicare claims from the Chronic Conditions Data Warehouse, 2010, and Kaiser Commission on Medicaid and the Uninsured and Urban Institute estimates based on FY2010 MSIS.
Dual-Eligible Beneficiaries as a Share of Medicare and Medicaid Enrollment and Spending, 2010 Medicare Medicaid Total Medicare enrollment, 2010:48.9 million Total Medicaid enrollment, 2010: 67.2 Million Total Medicaid spending, 2010:$340.5 billion Total Medicare spending, 2010:$498.9Billion SOURCE Medicare Payment Advisory Commission and Medicaid and CHIP Payment and Access Commission, Data Book: Beneficiaries Dually Eligible for Medicare and Medicaid(January 2015).
Comparison of Characteristics of Dual-Eligible Medicare Beneficiaries and All Other Medicare Beneficiaries Percent of beneficiaries: SOURCE: Kaiser Family Foundation analysis of the Medicare Current Beneficiary Survey 2010 Cost and Use file.
Distribution of Dual-Eligible Medicare Beneficiaries, by Amount of Medicare Spending, 2010 Average Spending, 2010 = $17,745 Median Spending, 2010 = $7,464 SOURCE: Kaiser Family Foundation analysis of a 5 percent sample of Medicare claims from the Chronic Conditions Data Warehouse, 2010.
Measures of Access to Care Among Medicare Beneficiaries by Demographic Characteristics, 2012 During the past year, percent of beneficiaries reporting that they… …had trouble getting needed care …delayed getting health care due to cost Overall Age Income Health Status NOTE: Excludes respondents who did not have Medicare eligibility for the full calendar year, such as new enrollees and decedents. Also excludes respondents who did not indicate incomes within specified ranges. All subgroup estimates are statistically significantly different from ‘overall’ estimate. SOURCE: Kaiser Family Foundation analysis of the Medicare Current Beneficiary Survey 2012 Access to Care file.
Percent of Office-Based Physicians Accepting New Patients with Medicare and Other Types of Insurance, 2012 NOTE: Pediatricians were excluded from Medicare and private non-capitated insurance categories. Physicians who did not respond to relevant survey questions were also excluded. The survey did not ask responding physicians to distinguish Medicare Advantage plans from traditional Medicare or other private insurance. Acceptance rates for patients with insurance status of self-pay or worker’s compensation are not shown. *Indicates difference from Medicare is statistically significant at the 95% confidence level. SOURCE: Kaiser Family Foundation analysis of National Ambulatory Medical Care Survey, National Electronic Health Records Survey, 2012.
Percent of Physicians Accepting New Medicare Patients by State, 2012 NOTE: Pediatricians are excluded from this analysis. Physicians were not asked to distinguish between patients in traditional Medicare and Medicare Advantage plans. SOURCE: Kaiser Family Foundation analysis of National Ambulatory Medical Care Survey, National Electronic Health Records Survey, 2012.
Accountable Care Organizations (ACOs) in Medicare, 2015 Pioneer ACO participants Medicare Shared Savings Program participants NOTE: Medicare Shared Savings Programs (MSSPs) include 35 Advanced Payment Model participants. Two MSSP participants in Puerto Rico are not displayed on the map. SOURCE: Kaiser Family Foundation analysis of data on ACOs, as of March 4, 2015 from Data.CMS.gov.
Medicare Hospital Readmission Rates, 2005-2013 Diagnosis of initial hospitalization NOTES: National readmission rates include Medicare fee-for-service unplanned hospitalizations for any cause within 30 days of discharge from an initial hospitalization for either heart failure, heart attach, or pneumonia. Rates are risk-adjusted for certain patient characteristics, such as age and other medical conditions. SOURCE: Kaiser Family Foundation analysis of CMS Hospital Compare data files.
Distribution of Federal Outlays, 2014 Total Federal Outlays, 2014 = $3.5 Trillion Net Federal Medicare Outlays, 2014 = $505 Billion NOTE: All amounts are for federal fiscal year 2014. 1Consists of Medicare spending minus income from premiums and other offsetting receipts. 2Other category includes spending on other mandatory outlays minus income from offsetting receipts). SOURCE: Congressional Budget Office, Budget and Economic Outlook: 2015 to 2025 (January 2015).
Distribution of Medicare Benefit Payments, 2014 Total Medicare Benefit Payments, 2014 = $597 billion NOTE: *Other services includes ambulance services, ambulatory surgical centers, community mental health centers, durable medical equipment, federally qualified health centers, hospice, hospital outpatient services not paid for using the outpatient prospective payment system, outpatient dialysis, outpatient therapy services, lab services, rural health clinics, Part B drugs; also includes amounts paid to providers and recovered. SOURCE: Kaiser Family Foundation analysis of data from Congressional Budget Office, 2015 Medicare Baseline (March 2015).
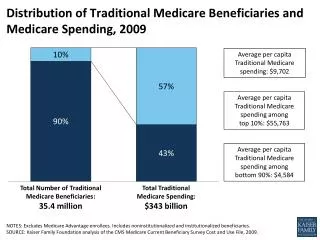
Distribution of Traditional Medicare Beneficiaries and Medicare Spending, 2010 Average per capita Traditional Medicare spending: $10,584 Average per capita Traditional Medicare spending among top 10%: $61,722 Average per capita Traditional Medicare spending among bottom 90%: $4,897 Total Number of Traditional Medicare Beneficiaries, 2010: 36.3 million Total Traditional Medicare Spending, 2010: $385 billion NOTE: Excludes Medicare Advantage enrollees. SOURCE: Kaiser Family Foundation analysis of the Medicare Current Beneficiary Survey 2010 Cost and Use file.
Percent of Personal Health Expenditures Accounted for by Medicare, 2013 NOTE: Total also includes durable medical equipment, other professional services, and other personal health care/products. Medicare spending does not exclude income from premiums and other offsetting receipts. Medicare coverage of nursing home care reflects spending on freestanding skilled nursing facilities only (not custodial long-term care services). SOURCE: Kaiser Family Foundation analysis of data from Centers for Medicare & Medicaid Services, Office of the Actuary, National Health Statistics Group, National Health Expenditures Tables (December 2014).
Medicare Spending and Percent of Federal Outlays and GDP, 2010-2025 Actual Net Outlays Projected Net Outlays Share of: Federal Outlays GDP NOTE: All amounts are for federal fiscal years; amounts are in billions and consist of Medicare spending minus income from premiums and other offsetting receipts. SOURCE: Kaiser Family Foundation based on data from Congressional Budget Office, Updated Budget Projections: 2015 to 2025 (March 2015); The 2014 Long-Term Budget Outlook (July 2014).
Historical and Projected Average Annual Growth Rate in Medicare Per Capita Spending and Other Measures Projected (2014-2023) Actual (2000-2013) NOTE: *Assumes 0.6-percent physician payment rate increase from 2016 through 2023, consistent with the average update over the 10-year period ending with March 31, 2015; based on the spending data from the 2014 Medicare Trustees report. SOURCE:Kaiser Family Foundation analysis of Medicare spending data from Boards of Trustees and Congressional Budget Office (CBO); private health insurance spending data from the CMS National Health Expenditure data; GDP data from CBO and U.S. Census Bureau, and CPI data from the Bureau of Labor Statistics (historical) and CBO (projected).
Sources of Medicare Revenue, 2013 SOURCE: Kaiser Family Foundation based on data from 2014 Annual Report of the Boards of Trustees of the Federal Hospital Insurance and Federal Supplementary Medical Insurance Trust Funds.
Solvency of the Medicare Part A Hospital Insurance Trust Fund Year of Medicare Trustees Report SOURCE: Intermediate projections from 2005-2014 Annual Reports of the Boards of Trustees of the Federal Hospital Insurance and Federal Supplementary Medical Insurance Trust Funds.
Number of Medicare Beneficiaries and Number of Workers Per Beneficiary, 2000-2050 In millions SOURCE: Kaiser Family Foundation based on the 2014 Annual Report of the Boards of Trustees of the Federal Hospital Insurance and Federal Supplementary Medical Insurance Trust Funds.