Download
1 / 48
510 likes | 768 Vues
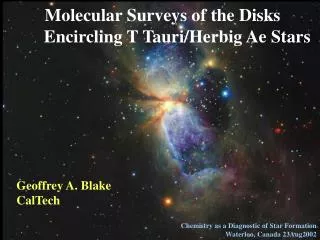
The Magnetic Fields on T Tauri Stars. Christopher M. Johns-Krull Rice University. Jeff A. Valenti (STScI) Hao Yang Antoun Daou (Rice) April D. Gafford (Berkeley, SFSU). April 18, 2008. Disks: A Natural Product of Star Formation. T Tauri Stars: Revealed Low Mass Young Stars.

E N D
The Magnetic Fields on T Tauri Stars Christopher M. Johns-Krull Rice University Jeff A. Valenti (STScI) Hao Yang Antoun Daou (Rice) April D. Gafford (Berkeley, SFSU) April 18, 2008
T Tauri Stars: Revealed Low Mass Young Stars • T Tauri Stars are optically visible • Late Type stars (G – M) • Ages of a few million years • Come in 2 flavors: CTTS and W/NTTS • CTTS disks diagnosed by IR radiation • Accretion onto star produces optical/UV excess
Disks Are Commonly Observed Around Young Stars • Now Imaged in the Optical, IR, and Radio • However, most of our knowledge comes from spectral energy distributions
Spectral Energy Distributions • Class 0: Proto-stellar cores • Class I: Young star with a disk has formed but substantial envelope remains • Class II: Envelope has largely dissipated, star and disk remain - CTTS • Class III: Just the star - NTTS
Disk Lifetimes: Frequency vs. Age This is the dust disk lifetime
Disk Regulated Rotation • Edwards et al. (1993) • NTTS have a range of rotation periods • CTTS are clustered near 9 days • Results have been questioned by Stassun et al. (1999) • See also Herbst et al. (2000) CTTS NTTS
The Close Circumstellar Environment Shu et al. (1994) Theory gives field at some point in the disk
Theoretical Predictions Konigl (1991): Cameron & Campbell (1993): Shu et al. (1994):
Early Measures of TTS Magnetic Fields • Basri et al. (1992) • Zeeman desaturation of optical line • R = 60,000 spectra • NTTS Tap 35 Bf ~ 1000 G • NTTS Tap 10 Bf < 1500 G Model with B/Model Without B
More Recent Field Measurements • Guenther et al. (1999) • Zeeman desaturation of optical lines • Possibly detected fields on 4 stars: CTTS and NTTS T Tau Bf ~ 2.5 kG
What Can Go Wrong • Same Fe I lines used • No Magnetic Field • Temperature Error of 300 K • Guenther et al. (1999) • LkCa 16, rmax = 0.71, Bf ~ 2 kG
A Good Example Johns-Krull & Valenti (1996, ApJ, 459, L95) Fe I TiO TiO s McDonald Observatory 2dCoude s Ti I vsini= 4.5 km/s
Getting Rid of the TiO Johns-Krull & Valenti (1996, ApJ, 459, L95) McDonald Observatory 2dCoude
Going to the Infrared • Johns-Krull, Valenti, & Koresko (1999) • NASA IRTF (3m) + CSHELL spectrometer • R ~ 35,000 spectra • Excess Broadening Clearly Seen in the Ti I line
Spectrum Synthesis • Full Stokes radiative transfer (Valenti & Piskunov 1998) • Line data checked against solar models/observations • NextGen model atmospheres (Allard & Hauschildt 1995) • Magnetic field lines assumed radial at the stellar surface • Distribution of field strengths allowed • Magnetic regions have same structure as quiet regions ** • Other relevant stellar parameters determined from high resolution (60,000) optical spectra or adopted from the literature
TW Hya: CTTS Yang, Johns-Krull, & Valenti (2005)
Hubble 4: NTTS Johns-Krull, Valenti, & Saar (2004)
Pressure Equilibrium Fields 12 TTS
The Surface of a T Tauri Star? • The optical continuum forms in something like the solar chromosphere • Polytropic models of TTS structure indicate that B field dominates only in outer 0.5-1.0%
Observed Fields & X-ray Emission Pevtsov et al. (2003) Johns-Krull (2007)
Field Geometry: Polarization NSO / Kitt Peak Magnetograph Jul 1999 Schrijver (2000)? Jan 1992
Field Geometry: Polarization from a Dipole • Brown & Landstreet (1981) • T Tau BZ < 816 G • Predicted 320-1280 G X 0.31 = 99-400 G • <B> = 2.4 kG gives BZ = 950 G • Johnstone & Penston (1986, 1987) • RU Lup: BZ< 494 G, Bp< 1400 G • GW Ori: BZ< 1.1 kG, Bp< 3.2 kG • CoD-34 7151: BZ< 2.0 kG, Bp< 5.8 kG, Bpred< 0.4 kG
The Close Circumstellar Environment Shu et al. (1994) Theory gives field at some point in the disk
New Polarization Observations of TTS • Johns-Krull et al. (1999a) • McDonald Observatory 2.7m • R = 60,000 echelle spectrometer • Zeeman Analyzer (Vogt 1980)
The Photospheric Field of BP Tau Johns-Krull et al. (1999a)
Additional Spectropolarimetry TW Hya • Recall, |B| = 2.6 kG BZ = 1040 G • Yang, Johns-Krull, & Valenti (2006) find BZ< 150 G T Tau • Recall, |B| = 2.4 kG BZ = 950 G • Smirnov et al. (2003): BZ = 160 +/- 40 G • Not confirmed by Smirnov et al. (2004) • Daou, Johns-Krull, & Valenti (2006) find BZ < 105 G (3σ) • Multiple observations rule out misaligned dipole at 97%
Polarization of Accretion Shock Material TW Hya: 1.8 kG BP Tau: 2.4 kG Johns-Krull et al. (1999a)
The Large Scale Field Likely Dipolar Shu et al. (1994) He I Polarization Theory gives field at some point in the disk
Polarization of Accretion Shock Material: Time Series Mahdavi & Kenyon (1998)
Art by Luis Belerique Assuming B Constant Konigl (1991) & Shu et al. (1994): Cameron & Campbell (1993):
Trapped Flux in the Shu et al. Model Shu et al. (1994) Theory gives field at some point in the disk
Trapped Flux Johns-Krull & Gafford (2002): • Trapped flux plus disk locking suggests: • Stellar dipole moment, *, should not enter per se • The only combination which give units of magnetic flux is: • We can set this equal to 4R*2faccB* • Therefore, a unique prediction of Ostriker & Shu (1995) is:
Observational Tests: Dipole Field r = 0.17 P = 0.51 • Valenti, Basri,& Johns (1993) • Low resolution, flux calibrated, blue spectra of a large sample of TTS • Fit NTTS + LTE Hydrogen slab models to spectra of CTTS • Give mass accretion rate and filling factor of slab emission Trapped Flux r = 0.79 P = 0.0002 Johns-Krull & Gafford 2002, ApJ, 573, 685
Conclusions • Magnetospheric Accretion Models • Require magnetic field strengths from 0.1-5 kG for specific stars • Yield fields that differ by scale factors related to assumed coupling • Imply stellar field not simply function of mass, radius, and rotation • Zeeman Broadening Measurements • Infrared sensitivity required to compensate for moderate rotation • Distribution of field strengths up to 6 kG in many T Tauri stars • Similar field strengths on most T Tauri stars (with and without disks) • Circular Polarization Measurements • Photospheric absorption lines rule out global dipolar field • Helium emission line formed in accretion shock is strongly polarized • Rotational modulation implies magnetic field not rotationally symmetric
Conclusions • Comparison of TTS Field Measurements with Theory • Mean fields show no correlation • Accretion shock fields show some correlation • Specific geometry of the fields likely the key • Trapped flux model of Shu et al. Supported by correlation analysis