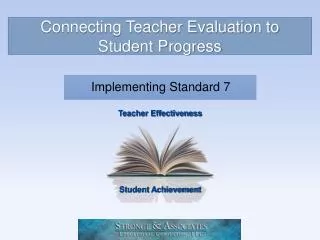
Connecting School-Based Administrator Evaluation to Student Academic Progress
320 likes | 504 Vues
Connecting School-Based Administrator Evaluation to Student Academic Progress. FAIRFAX COUNTY PUBLIC SCHOOLS. SMARTR Goals for School-Based Administrators. James Stronge, Ph.D. Organizing Questions. 1. 2. 3.

Connecting School-Based Administrator Evaluation to Student Academic Progress
E N D
Presentation Transcript
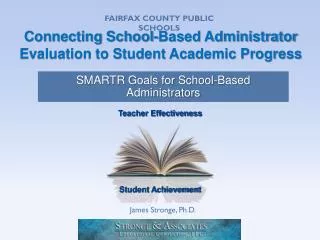
Connecting School-Based Administrator Evaluation to Student Academic Progress FAIRFAX COUNTY PUBLIC SCHOOLS SMARTR Goals for School-Based Administrators James Stronge, Ph.D.
Organizing Questions 1 2 3 What should we know in using SMARTR goals in school-based administrator evaluation? How are SMARTR goals rated in Standard 7 – Student Academic Progress? What are the requirements for school-based administrator SMARTR goals?
Organizing Question #1 1 3 1 What are the requirements for school-based administrator SMARTR goals?
Requirement by the Code of Virginia …and that includes, among other things, an assessment of such administrators' skills and knowledge; student academic progress and school gains in student learning [emphasis added]; and effectiveness in addressing school safety and enforcing student discipline. The division superintendent shall implement such performance evaluation process in making employment recommendations to the school board pursuant to § 22.1-293.”
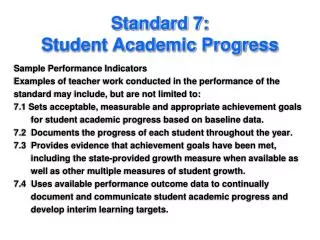
Standard 7: Student Academic Progress The school-based administrator’s leadership results in acceptable, measurable student academic progress based on established standards.
Standard 7: Student Academic Progress Sample Key Elements Examples may include, but are not limited to: • 7.1 Collaboratively develops, implements, and monitors the school improvement plan that results in increased student academic progress. • 7.2 Utilizes research-based techniques for gathering and analyzing data from multiple measures to use in making decisions related to student academic progress and school improvement. • 7.3 Collaborates with teachers and staff to monitor and improve • multiple measures of student progress through the analysis of • data, the application of educational research, and the implementation • of appropriate intervention and enrichment strategies. • 7.4 Sets benchmarks and implements appropriate strategies and • interventions to accomplish desired outcomes
Standard 7: Student Academic Progress Sample Key Elements Examples may include, but are not limited to: • 7.5 Provides evidence that students are meeting measurable, reasonable, and appropriate achievement goals. • 7.6 Demonstrates responsibilities for school academic achievement • through proactive interactions with faculty/staff, students, and • other stakeholders. • 7.7 Collaboratively develops, implements, and ensures teachers’ • student achievement goals are aligned with building-level goals for • increased student academic progress and for meeting state • benchmarks.
Standard 7: Student Academic Progress Recommendations* • Include multiple measures of student academic • progress • Use student academic progress goals or other • measures of student progress • Account for 40 percent of the school-based administrator’s Summative Performance Evaluation • * Source: 2011 Guidelines for Uniform Performance Standards and Evaluation Criteria for Principals
Guidance on Measures of Student Academic Progress • Give priority to quantitative measures already available in the school that are valid and provide valid measures of growth. • Use SMARTR goal setting or other measures that incorporate data from validated achievement measures whenever possible. • Have at least one SMARTR goal included in the evaluation.
Our Second Focus Area What should we know in using SMARTR goals in school-based administrator evaluation?
How do school-based administrator and teacher goal setting compare?
How do school-based administrator and teacher goal setting compare? • The goal setting process is the same. Step 1: Determine needs Step 3: Create and implement leadership and management strategies Step 2: Create specific growth goals using baseline data Step 4: Monitor progress through ongoing data collection Step 5: Assess goal attainment
How do school-based administrator and teacher goal setting compare? • Evaluating the goal using SMARTR criteria is the same. The goal must be…
Is this a SMARTR goal? • Evaluate the goals using the SMARTR criteria. • If it does not meet all SMARTR criteria, how can it be revised? Reword the goal. • Be prepared to share with the entire group. Let’s practice evaluating SMARTR goals.
School-based Administrator SMARTR Goal 1 By the end of the 2013-2014 school year, English 8 SOL pass rates will increase by ten percent (from 85 percent during the 2012-2013 school year to 93.5 percent).
School-Based Administrator SMARTR Goal 2 By the end of the 2013-2014 school year, English 8 SOL pass rates of English Language Learner students will increase by 15 percent (from 50 percent during the 2012-2013 school year to 57.5 percent).
Comparing the SMARTR Goals • Compare the two SMARTR goals (which are from the same school). • Which of the two SMARTR goals might be better? Why? • Discuss this with your group.
How do school-based administrator and teacher goal setting contrast?
Differences Between Teacher and School-based Administrator Goals Teacher goals are typically… School-based administrator goals are typically… • Based on smaller numbers of students: micro-vision • Focused on individual student growth • Strongly influenced by individual student characteristics • Loosely correlated to school improvement plans • Based on larger populations of students: macro-vision • Focused on percentage of students reaching mastery • Less influenced by individual student characteristics • Highly correlated to school improvement plans
Baseline and Post-Measures Used for teachers… Used for school-based administrators… • Usually take place in the same year • Use the same group of students • Often take place from one year to the next • Use different groups of students
Example Goals Teacher School-Based Administrator By the end of the 2013-2014 school year, 100 percent of my AP History students will increase their analysis of historical documents skills as determined by the AP History test Data Based Question (DBQ) rubric. Each student’s post-assessment score will increase by two levels above the pre-assessment score. By the end of the 2013-2014 school year, the percentage of students passing at least one college-level course (AP, IB, or dual enrollment) out of the total eligible student population will increase by 10 percent (to 60 percent over last year’s 54 percent).
Our Last Area of Focus How are SMARTR goals rated in Standard 7 – Student Academic Progress?
Administrator Matrix Rules Explained: Effective By the end of the 2013-2014 school year, the percentage of students enrolled in at least one college-level course (AP, IB, or dual enrollment) out of the total eligible student population will increase by 10 percent over student enrollment (in these courses) in 2012-2013. EFFECTIVE: At least eighty percent of students and/or programs meet and/or exceed SMARTR Goal. In the 2012-2013 school year, there were 400 AP/dual enrollment students. A ten percent increase is 40 students (400 * 0.10 = 40) A ten percent increase would be 440 AP/dual enrollment students in the 2013-2014 school year. Effective Equation N ≥ [Last Year’s Total AP/Dual Population + (Student Increase * 0.8)] 400 + (40 * 0.8) 400 + 32 = 432 Effective ≥ 432 AP/dual enrollment students
Administrator Matrix Rules Explained: Highly Effective By the end of the 2013-2014 school year, the percentage of students enrolled in at least one college-level course (AP, IB, or dual enrollment) out of the total eligible student population will increase by 10 percent over student enrollment (in these courses) in 2012-2013. HIGHLY EFFECTIVE: At least ninety percent of students and/or programs meet and/or exceed SMARTR Goal. In the 2012-2013 school year, there were 400 AP/dual enrollment students. A ten percent increase is 40 students (400 * 0.10 = 40) A ten percent increase would be 440 AP/dual enrollment students in the 2013-2014 school year. Highly Effective Equation N ≥ [Last Year’s Total AP/Dual Population + (Student Increase * 0.9)] 400 + (40 * 0.9) 400 + 36 = 436 Highly Effective ≥ 436 AP/dual enrollment students
Administrator Matrix Rules Explained: Developing/Needs Improvement By the end of the 2013-2014 school year, the percentage of students enrolled in at least one college-level course (AP, IB, or dual enrollment) out of the total eligible student population will increase by 10 percent over student enrollment (in these courses) in 2012-2013. DEVELOPING/NEEDS IMPROVEMENT: At least fifty percent of students and/or programs meet and/or exceed SMARTR Goal. In the 2012-2013 school year, there were 400 AP/dual enrollment students. A ten percent increase is 40 students (400 * 0.10 = 40) A ten percent increase would be 440 AP/dual enrollment students in the 2013-2014 school year. Developing/Needs Improvement Equation N ≥ [Last Year’s Total AP/Dual Population + (Student Increase * 0.5)] 400 + (40 * 0.5) 400 + 20 = 420 Developing/Needs Improvement ≥ 420 AP/dual enrollment students
Administrator Matrix Rules Explained: Ineffective By the end of the 2013-2014 school year, the percentage of students enrolled in at least one college-level course (AP, IB, or dual enrollment) out of the total eligible student population will increase by 10 percent over student enrollment (in these courses) in 2012-2013. Ineffective: Less than fifty percent of students and/or programs meet and/or exceed SMARTR Goal. In the 2012-2013 school year, there were 400 AP/dual enrollment students. A ten percent increase is 40 students (400 * 0.10 = 40) A ten percent increase would be 440 AP/dual enrollment students in the 2013-2014 school year. Ineffective Equation N < [last Year’s Total AP/Dual Population + (Student Increase * 0.5)] 400 + (40 * 0.5) 400 + 20 = 420 Ineffective < 420 AP/dual enrollment students
Administrator Matrix Rules for SMARTR Goal Setting By the end of the 2013-2014 school year, the percentage of students enrolled in at least one college-level course (AP, IB, or dual enrollment) out of the total eligible student population will increase by 10 percent over student enrollment (in these courses) in 2012-2013.